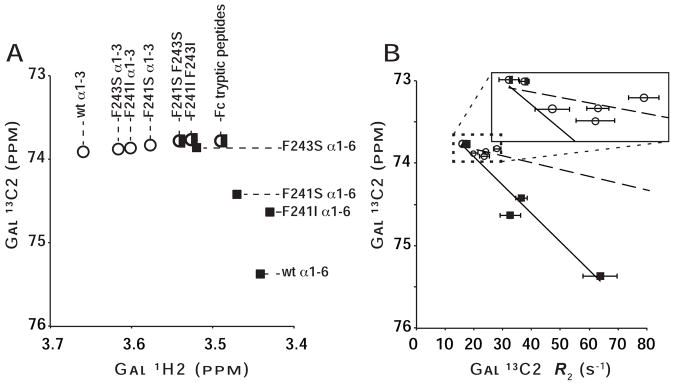
Figure 4. Fc mutations impact the structure and mobility of N-glycan termini as judged by solution NMR spectroscopy.

(A) Peaks from both N-glycan branches migrate incrementally away from those of the corresponding Fc wt peak and toward that of proteolyzed Fc. Spectra, from which this plot was generated, are shown in Figure S5. (B) The degree of line broadening for the (α1–6 branch)Gal 13C2 (black squares) correlates strongly with the resonance frequency (R2=0.95), indicating the frequency is sensitive to glycan mobility (R2 for α1–3=0.36; open circles). Points from (α1–3 branch)Gal and (α1–6 branch)Gal measurements are denoted with open circles or filled squares, respectively. Peaks with overlapped signals are marked with a half open circle/half filled square.
