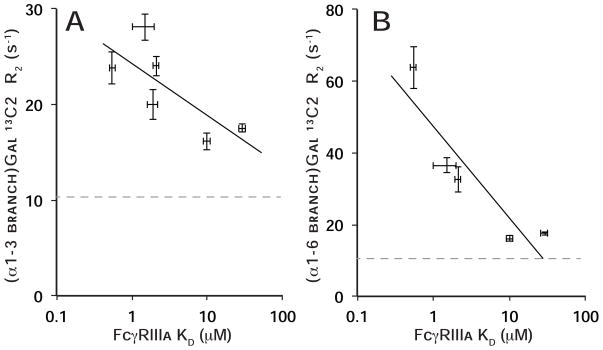
Figure 5. The degree of line broadening (R2) for the (α1–3 branch)Gal 13C2(A) or (α1–6 branch)Gal 13C2(B) nuclei correlates with FcγRIIIa binding affinity.
Standard deviations of the mean are included for both dimensions. The R2 for the same nucleus on a proteolyzed Fc fragment is shown for comparison to provide an experimental lower bound (dashed gray line). The coefficient of determination (R2) of a line fitted to each data set is 0.55 (A) and 0.82 (B).

