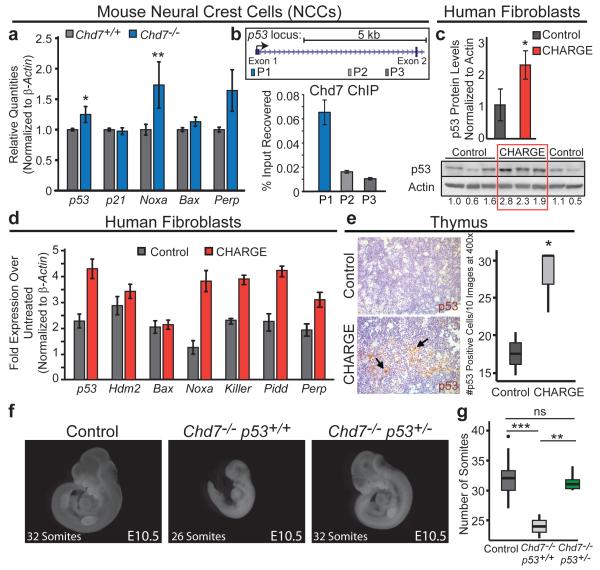
Figure 4. p53 is Activated Upon Chd7 Deficiency and Contributes to Chd7-null Phenotypes.
(a) p53 target gene expression in Chd7+/+ and Chd7−/− (whi/whi) NCCs. Averages+/−s.e.m. normalized to β-actin (n=5). *,**p-values<0.05,<0.01, one-tailed Mann-Whitney test. (b) Top: 5′ end of p53 locus. Bottom: Representative of triplicate ChIP analyses of Chd7 binding at p53 promoter (P1) and negative control open-chromatin regions (P2 and P3), relative to input. +/−s.d. of technical triplicates. (c) Bottom: p53 immunoblot of human fibroblasts derived from unaffected and CHARGE patients. (Below: p53 levels after normalization to Actin.) Top: Averages+/−s.d of p53 levels. *p-value=0.015, one-tailed Student’s t-test. (d) p53 target gene expression in low-serum treated human fibroblast cells derived from unaffected and CHARGE patients relative to untreated samples. 5 CHARGE cell lines analyzed in duplicate. Representative cell line pair is shown, +/−s.d. of technical triplicates. (e) Left, p53 immunohistochemistry on thymi from fetuses with CHARGE syndrome and unaffected fetuses. Arrows: p53-positive cells. Right, The number of p53-positive cells per ten fields at 400× magnification, from one section. (f) Comparison to control and Chd7−/−p53+/+ embryos reveals partial rescue of E10.5 Chd7−/−p53+/− embryos. (Chd7−/− p53+/+: n=3; Chd7−/−p53+/−: n=6). (g) Embryo somite number for each genotype. ns=non-significant, **,***p-value=0.0024,0.00032, two-tailed Student’s t-test.

