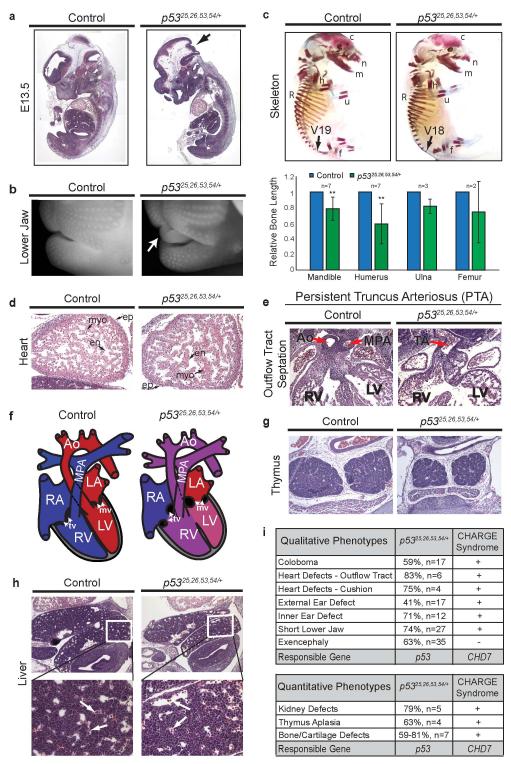
Extended Data Figure 4. p5325,26,53,54/+ Embryos Exhibit Additional Features of CHARGE Syndrome.
(a) H&E-stained sections of E12.5 control (left) and p5325,26,53,54/+ embryos (right). Examination confirmed neural tube closure defects (arrow). (b) Close-up image of UV-illuminated, ethidium bromide-stained E15.5 p5325,26,53,54/+ embryo (right) to highlight short lower jaw phenotype with protruding tongue (arrow) compared to control littermate (left). 74% (n=27) of p5325,26,53,54/+ embryos exhibited short lower jaw. Cleft lip not shown. (c) Top: Alizarin Red (bone) and Alcian Blue (cartilage) whole-mount stained E15.0 p5325,26,53,54/+ embryo (right) showing reduced bone density in the cranium (c) and nasal cavity (n); shorter ulna (u), humerus (h), mandible (m), and femur (f); and reduced bone formation in the ribs (R), where fewer vertebrae are undergoing ossification relative to control littermate (left). Number of vertebrae with bone formation: 19 in control (arrow; V19) versus 18 in p5325,26,53,54/+ embryo (arrow; V18). The severity of bone and cartilage defects is variable, with the most severe defects evident in embryos with exencephaly and severe craniofacial defects. n=7. Bottom: Quantification of bone lengths shown as percent of E14.5-15.0 littermate controls. Bone lengths of the mandible, humerus, ulna, and femur were measured using the ruler function in Adobe Photoshop on images taken at 6.3×. Only litters with detectable bone formation in p5325,26,53,54/+ embryos were included in bone length analyses. Student’s T-test **p=0.008 (mandible), **p=0.005 (humerus). (d) Representative images of H&E-stained sagittal sections of E12.5 control (left) and p5325,26,53,54/+ hearts (right) showing all three cardiac cell types in both genotypes. en: endocardium; ep: epicardium; myo: myocardium (arrows). (e) H&E-stained E12.5 p5325,26,53,54/+ heart exhibiting persistent truncus arteriosus (PTA) (33%, n=6). The cardiac outflow tract in the control embryo (left) is septated into the aorta (Ao) and main pulmonary artery (MPA), whereas the cardiac outflow tract (truncus arteriosus or TA) in the p5325,26,53,54/+ embryo (right) remains unseptated, resulting in PTA. (f) Illustration of control heart (left) and p5325,26,53,54/+ embryo heart (right), highlighting DORV and atrioventricular cushion defects. Both the aorta (Ao) and main pulmonary artery (MPA) flow out from the right ventricle (RV), resulting in mixed oxygenated and deoxygenated blood in systemic circulation when combined with concurrent VSDs (ventricular septal defects). The atrioventricular cushions remain bulbous and fail to elongate into mature valve leaflets (mitral valve: mv; tricuspid valve: tv). Red: oxygenated blood; Blue: deoxygenated blood; Purple/Pink: mixed oxygenated/deoxygenated blood. (g) Representative H&E-stained transverse section of thymus in p5325,26,53,54/+ E15.5 embryo (right) reveals smaller thymus compared to control littermate (left) (63% of control; n=4). (h) Representative H&E analysis of liver sections from E12.5 control (left) and p5325,26,53,54/+ embryos (right) showing normal liver architecture in both genotypes (top). High magnification image (bottom) of the region of the liver outlined by the white box in the top panel shows the presence of nucleated erythrocytes (arrows), indicating proper hematopoiesis. (i) Top: Table summarizing the incidence (%) and sample size (n) for phenotypes assessed qualitatively in p5325,26,53,54/+ embryos. The occurrence of these phenotypes in CHARGE syndrome is also indicated (+ present, − absent). Bottom: Table summarizing phenotypes assessed quantitatively in p5325,26,53,54/+ embryos relative to controls, shown as the percent average size of controls (%), with sample size (n) also indicated. The occurrence of these phenotypes in CHARGE syndrome is also shown (+ present). Detailed description of bone and cartilage defects can be found in Extended-Data Fig. 4c.

