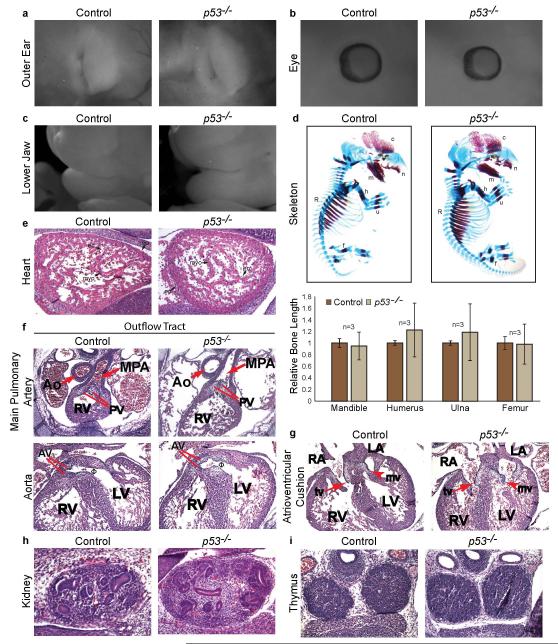
Extended Data Figure 5. p53−/−− Embryos Do Not Exhibit Characteristics of CHARGE Syndrome.
(a) Whole-mount image of the external ear of E15.5 p53−/− embryo (right) and control embryo (left) showing normal ear pinna development. (b) Whole mount image of E13.5 p53−/− embryo (right) and control embryo (left) showing normal retinal development and no evidence of coloboma. (c) Whole-mount image of E15.5 p53−/− embryo (right) and control embryo (left) with normal lower jaw development. (d) Alizarin Red (bone) and Alcian Blue (cartilage) whole-mount stained E14.5 p53−/− embryo (right) showing normal long bone formation of the ulna (u), humerus (h), mandible (m), and femur (f) relative to control littermate (left). Bottom: Quantification of bone lengths shown as percent of E14.5 littermate controls (n=3). (e) Representative images of H&E-stained sagittal sections of E13.5 control (left) and p53−/− hearts (right) showing all three cardiac cell types in both genotypes. en: endocardium; ep: epicardium; myo: myocardium (arrows). (f) Analysis of H&E-stained transverse sections of E13.5 p53−/− and control hearts revealing normal outflow tract development. (Top) The main pulmonary artery (MPA) and aorta (Ao) are fully septated, and the MPA connects to the right ventricle (RV) in p53−/− hearts. (Bottom) The aorta connects to the left ventricle (LV). Φventricular outflow tract that connects the left ventricle and aorta. PV: pulmonary valve, AV: aortic valve (g) Analysis of transverse sections of H&E-stained E13.5 p53−/− hearts (right) reveals normal atrioventricular cushions which have remodeled to form mature, elongated mitral (mv, arrowhead) and tricuspid (tv, arrow) valves similar to control hearts (left). RA: right atrium; LA: left atrium; RV: right ventricle; LV: left ventricle. (h) H&E-stained sagittal section of kidney from p53−/− (right) and control embryos (left) showing normal renal size and development. (i) H&E-stained transverse section of thymi in p53−/− E13.5 embryo (right) reveals similar thymus size compared to control littermate (left).

