Figure 6.

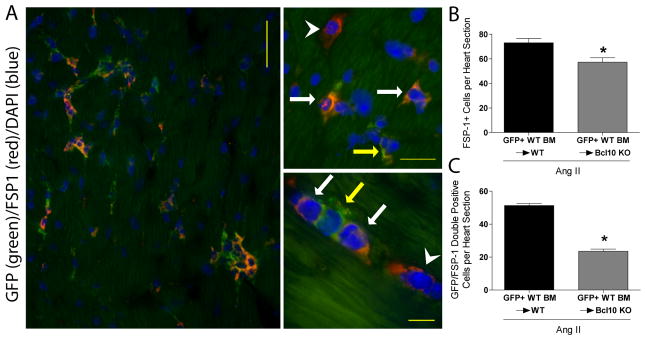
Assessment of bone marrow (BM)-derived cardiac fibroblast. BM of green fluorescent protein (GFP) expressing wildtype (WT) mice were transplanted in irradiated WT and Bcl10 knockout (KO) and infused with Ang II. (A) Representative photomicrographs of infiltrating cells (left photomicrograph). On the right side (upper and lower photomicrographs) higher magnification is shown. We detected GFP/fibroblast specific protein (FSP) 1 double-positive cells (orange cells; indicated by the white arrow), FSP1+/GFP- single-positive cells (red; indicated by the white arrowhead) as wells as FSP1-/GFP+ single-positive leukocytes (green; indicated by the yellow arrow). (B) Number of FSP1 single-positive cells and (C) infiltrating GFP/FSP1 double positive cells. *P<0.01 versus GFP+ WT BM→WT, unpaired t-test, n=4/group.
