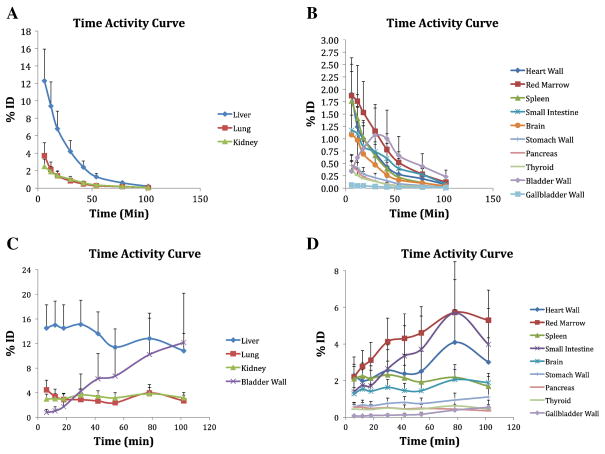
Figure 3.
Mean percentage injected dose (ID) as a function of time of the main organs. Vertical bars represent SD. Panels A and B show non-decay-corrected data for organs with higher (liver, lung, and kidney) and lower percentages of ID, respectively. Panels C and D show decay-corrected data for organs with higher and lower percentages of ID, respectively

