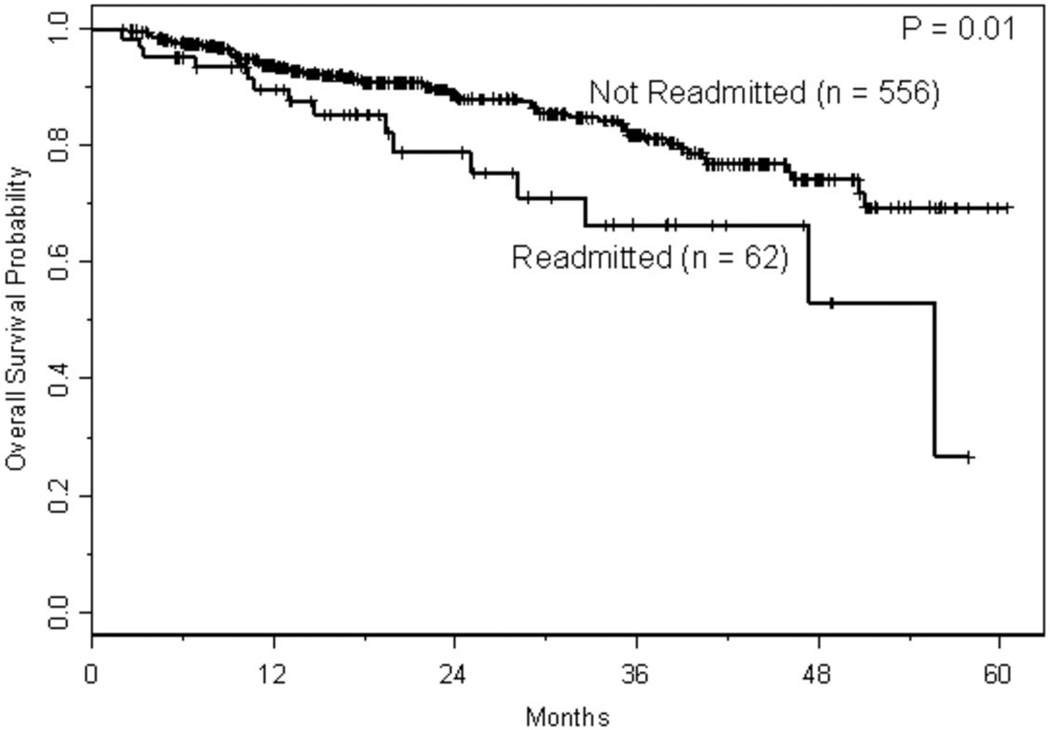
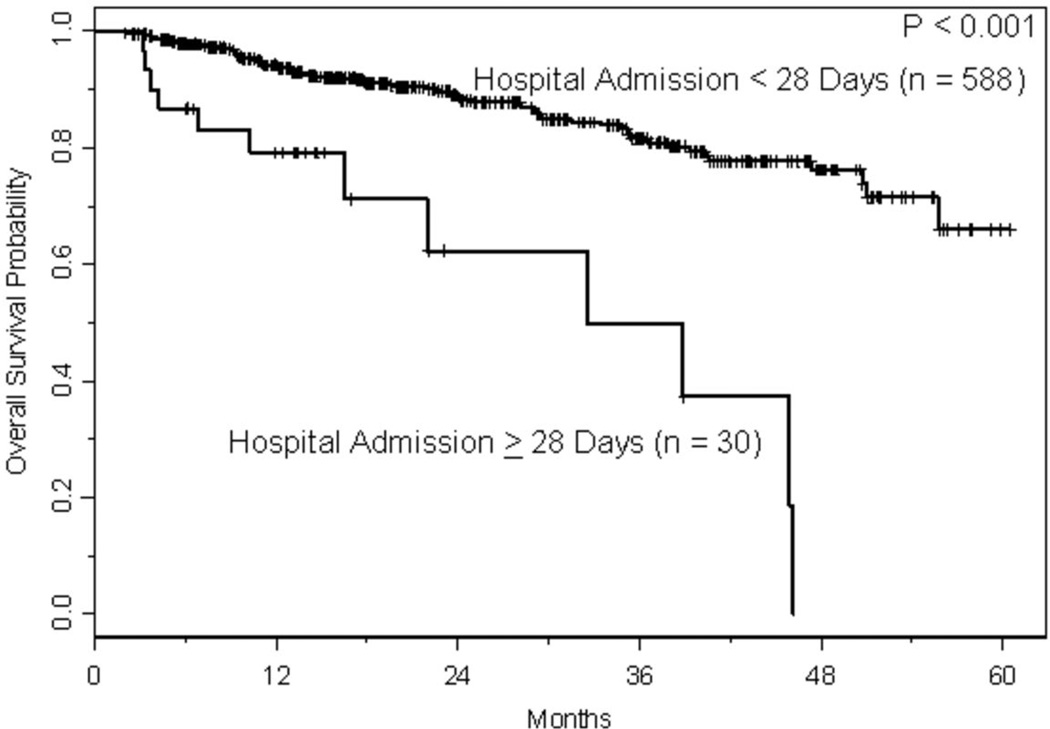
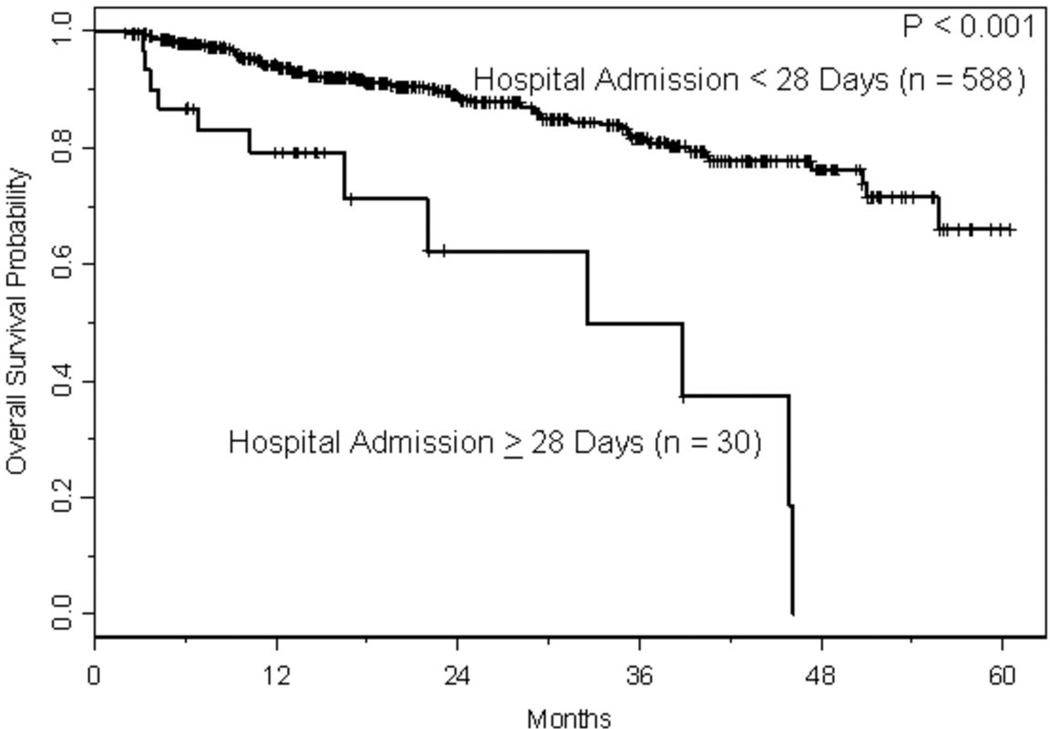
Figure 3.
a. Kaplan-Meier curves for overall survival based on readmission within 30 days of discharge. Overall survival was calculated from a landmark time of 30 days following date of discharge until the date of death or last follow-up. Only patients who were still at risk 30 days following date of discharge were included.
b. Kaplan Meier curve for overall survival based on length of stay. Overall survival was calculated from a landmark time of 30 days following date of discharge until the date of death or last follow-up. Only patients who were still at risk 30 days following date of discharge were included.
c. Kaplan Meier curve for overall survival based on chemosensitivity prior to transplant. Overall survival was calculated from a landmark time of 30 days following date of discharge until the date of death or last follow-up. Only patients who were still at risk 30 days following date of discharge were included.


