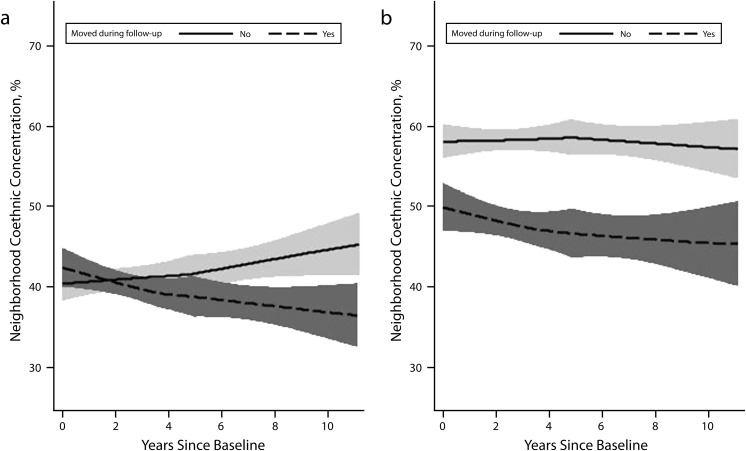
FIGURE 1—
Unadjusted locally weighted smoothed curves of neighborhood coethnic concentration over follow-up, by move status, among (a) Chinese foreign-born sample participants and (b) Hispanic foreign-born sample participants: Multi-Ethnic Study of Atherosclerosis, United States, 2000–2002 to 2010–2012 waves.
Note. Shaded bands represent 95% confidence intervals.

