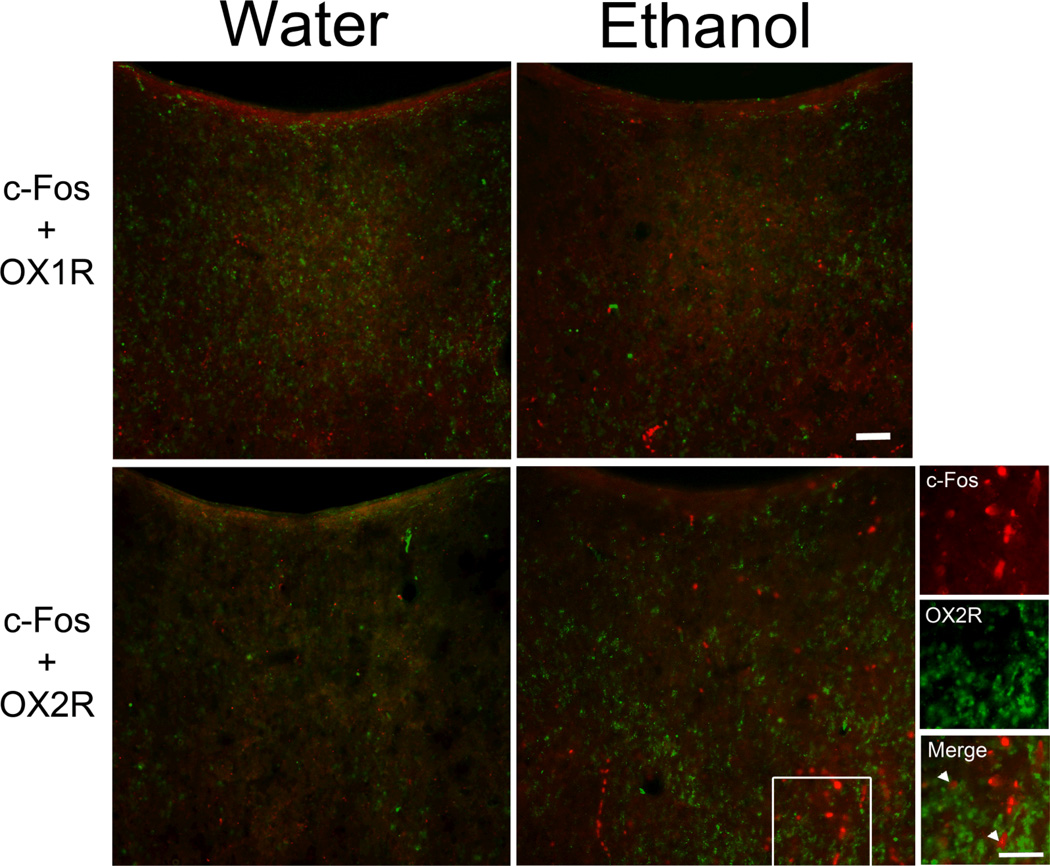
Figure 6.
Photomicrographs showing greater double-labeling of c-Fos immunoreactivity with the orexin 2 receptor (OX2R) but not orexin 1 receptor (OX1R) in the anterior paraventricular thalamus (aPVT) 90 minutes after oral 20% ethanol (1.50 g/kg/gavage) compared to water gavage (Set 3, n = 6/group; 11 treatments). Similar results were obtained when comparing the High to Low Ethanol groups (0.75 g/kg) and the Water to Control groups (images of Low Ethanol and Control groups not shown). c-Fos-positive cells are labeled in red, and receptor-positive cells are labeled in green. Images on the far right are higher magnifications of image marked with a white square. Arrowheads indicate double-labeled neurons. Scale bars = 50 µm.

