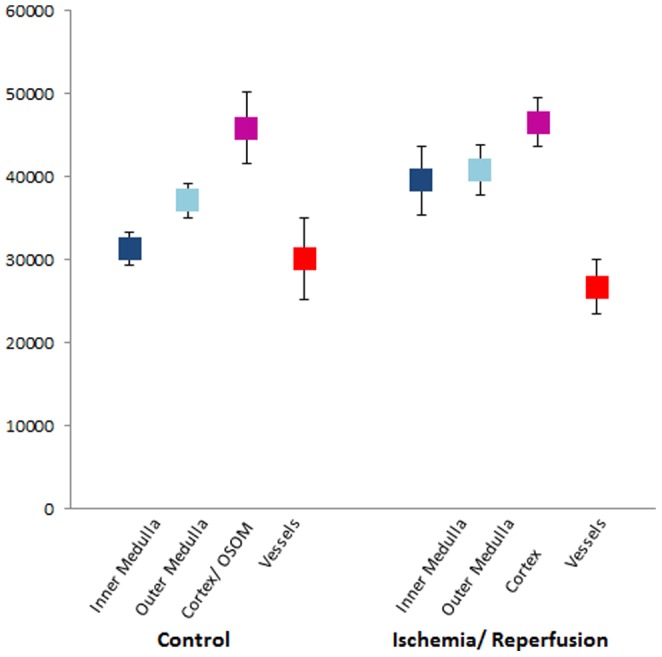
Figure 3. Mean Gray Values of Kidney Compartments.

Mean value and standard deviations of phase gray values of the respective compartment. Note that OSOM and cortex were assessed together in healthy kidneys and OSOM and ISOM together in I/R kidneys. OSOM – outer stripe outer medulla ISOM – inner stripe outer medulla.
