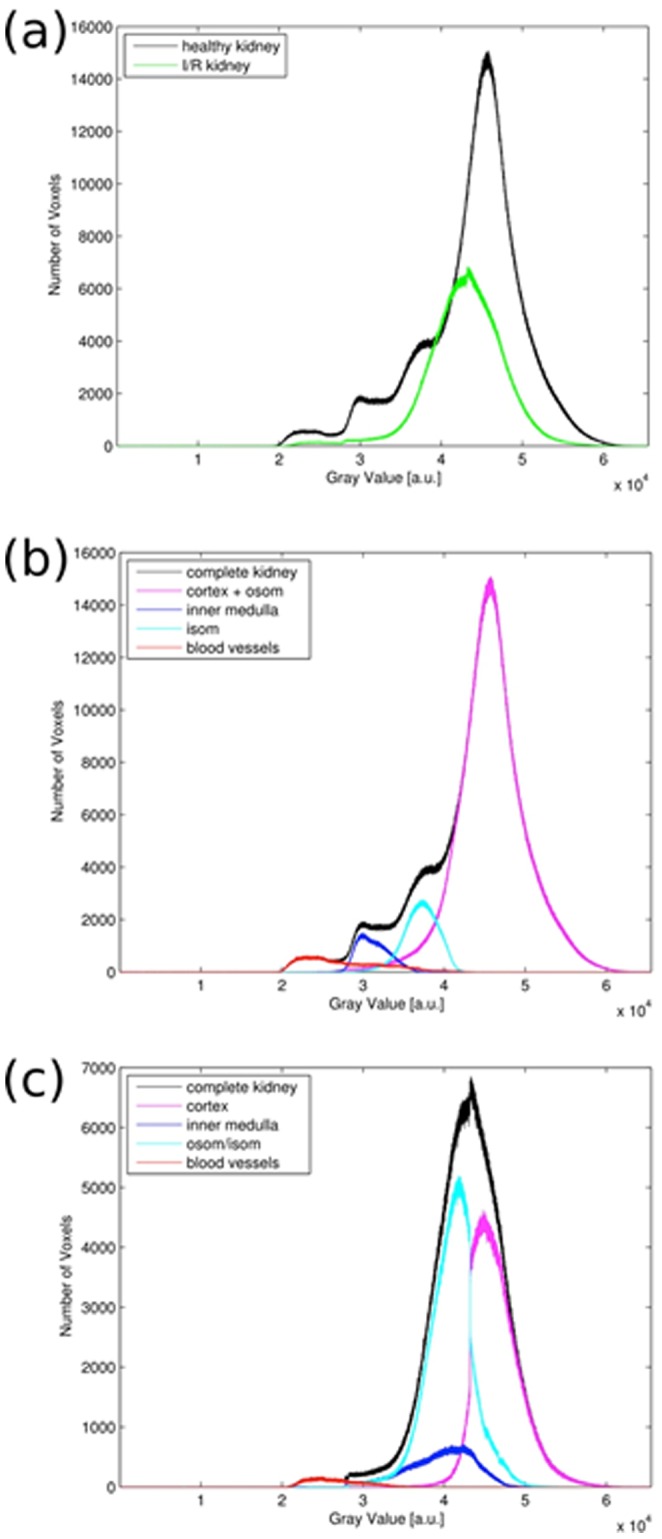
Figure 4. Volumetry of Healthy and I/R Kidney.

Gray values are proportional to electron densities. (a) Histogram for both complete kidney volumes in comparison. (b) Histogram of healthy kidney and the contributions of the different compartments. (c) Histogram of post-ischemic kidney and the contributions of the different compartments. OSOM – outer stripe outer medulla; IS – inner stripe.
