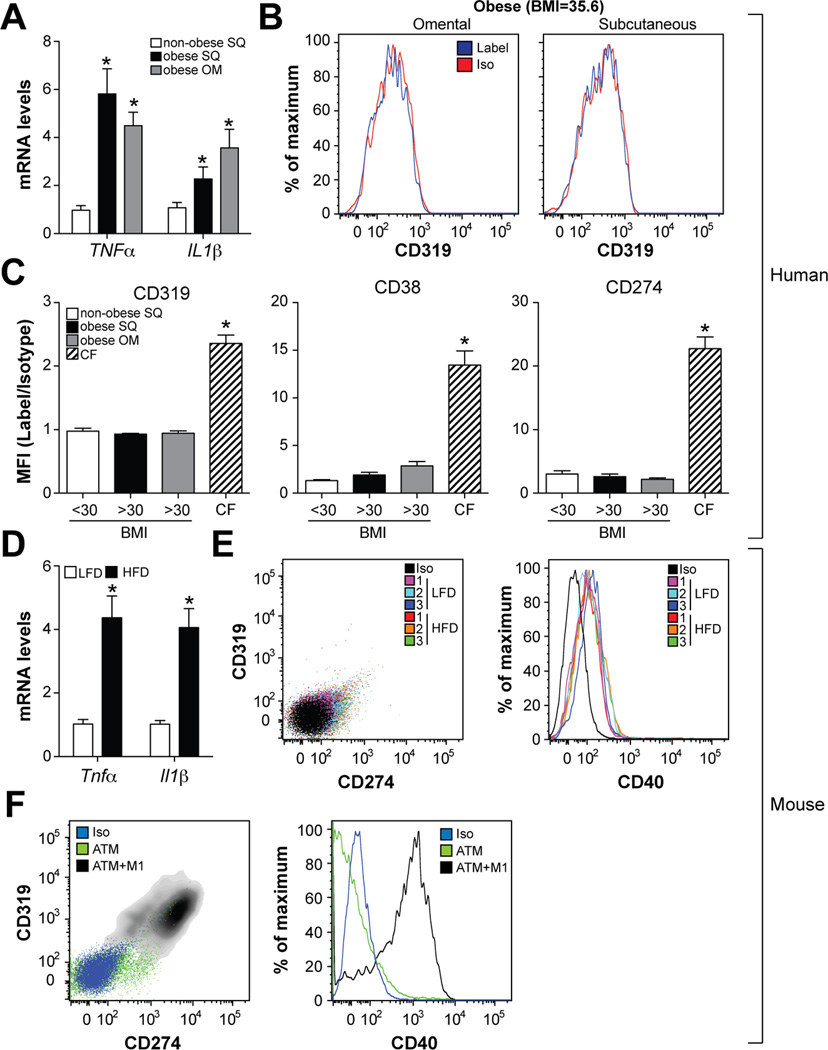
Fig. 2. ATMs of obese humans and mice are not classically activated.
Panels A-C: Omental (OM) and subcutaneous (SQ) adipose tissue was collected from obese subjects (BMI>30kg/m2) undergoing bariatric surgery (N=7). For comparative purposes, subcutaneous adipose tissue was collected from non-obese subjects (BMI<30kg/m2) undergoing abdominoplasty (N=7). Panel A: Pro-inflammatory cytokine expression. Panel B: Cell surface CD319 levels in ATMs (defined as CD14+CD15−CD206+CD1c−) from a representative obese subject. Panel C: Cell surface levels of CD38, CD274, and CD319 in ATMs from non-obese and obese subjects and airway macrophages from CF patients; results are signal-to-noise ratio in mean fluorescence intensity (MFI). Panels D-F: Male C57BL/6 mice were place on a low-fat diet (LFD) or high-fat diet (HFD) for 16 weeks and ATMs from epididymal fat were isolated. Panel D: Pro-inflammatory cytokine expression. Panel E: ATM cell surface CD319, CD274, and CD40 levels. Panel F: ATM cell surface CD319, CD274, and CD40 levels in the presence and absence of M1 stimuli. Where applicable, results are means and SEMs; *, denotes p<0.05, t-test relative to non-obese or LFD; N=4–7. See also Fig. S3.

