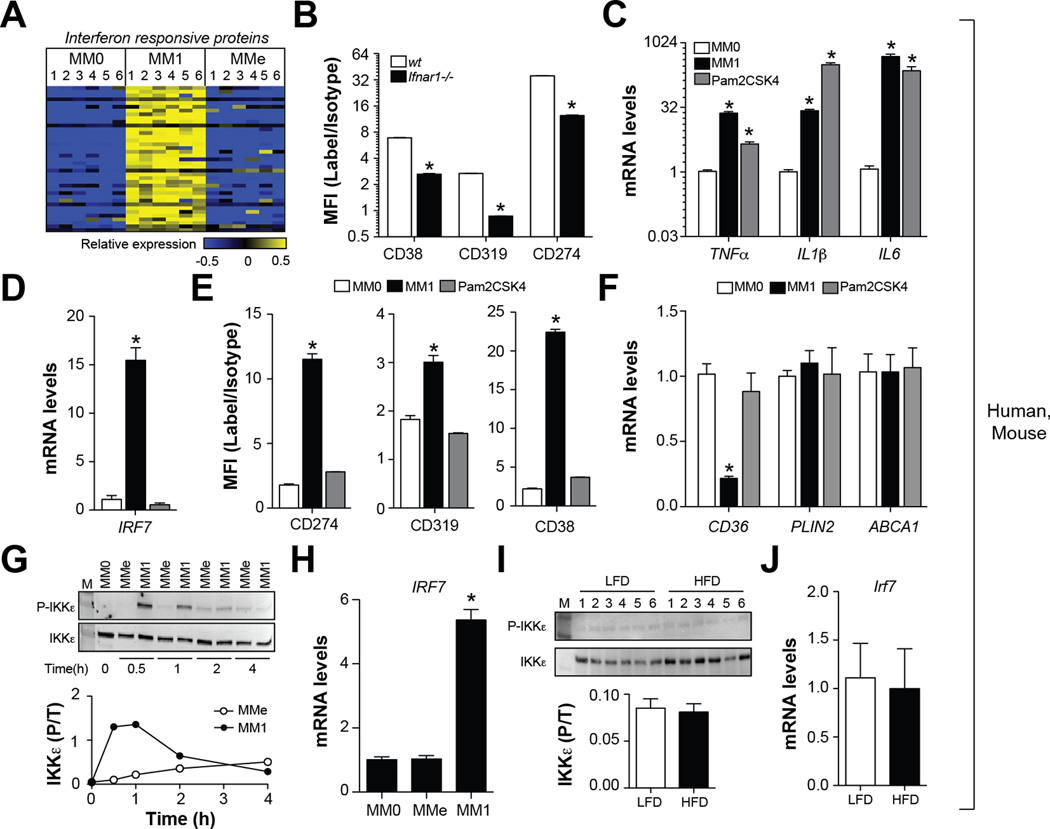
Fig. 5. Metabolic activation fails to induce the type I interferon response.
Panel A: Heatmap depicts regulation of interferon-regulated proteins across human MM0, MM1, and MMe cells (blue = down-regulated, yellow = up-regulated). Panel B: Comparison of M1 cell surface marker levels in MM1 macrophages made from wt and Ifnar−/− mice. Panels C-F: Human MM0 macrophages were classically activated or treated with Pam2CSK4, a selective agonist for TLR2. Panel C: Pro-inflammatory cytokine expression. Panel D: IRF7 expression. Panel E: M1 cell surface markers were quantified by flow cytometry. Panel F: qRT-PCR analysis of MMe markers. Panels G-H: Human MM0 macrophages were classically or metabolically activated. Panel G: Immunoblotting for total and phosphorylated (P-Ser172) IKKε. Panel H: IRF7 expression. Panels I-J: Male C57BL/6 mice were place on a low-fat diet (LFD) or high-fat diet (HFD) for 16 weeks and ATMs from epididymal fat were isolated. Panel I: Immunoblotting for total and phosphorylated (P-Ser172) IKKε. Panel J: IRF7 expression in purified ATMs. Where applicable, results are means and SEMs; *, denotes p<0.05, t-test relative to MM0; N=4–6. Flow cytometry results are expressed as signal-to-noise ratios in the mean fluorescence intensity (MFI). See also Fig. S5.

