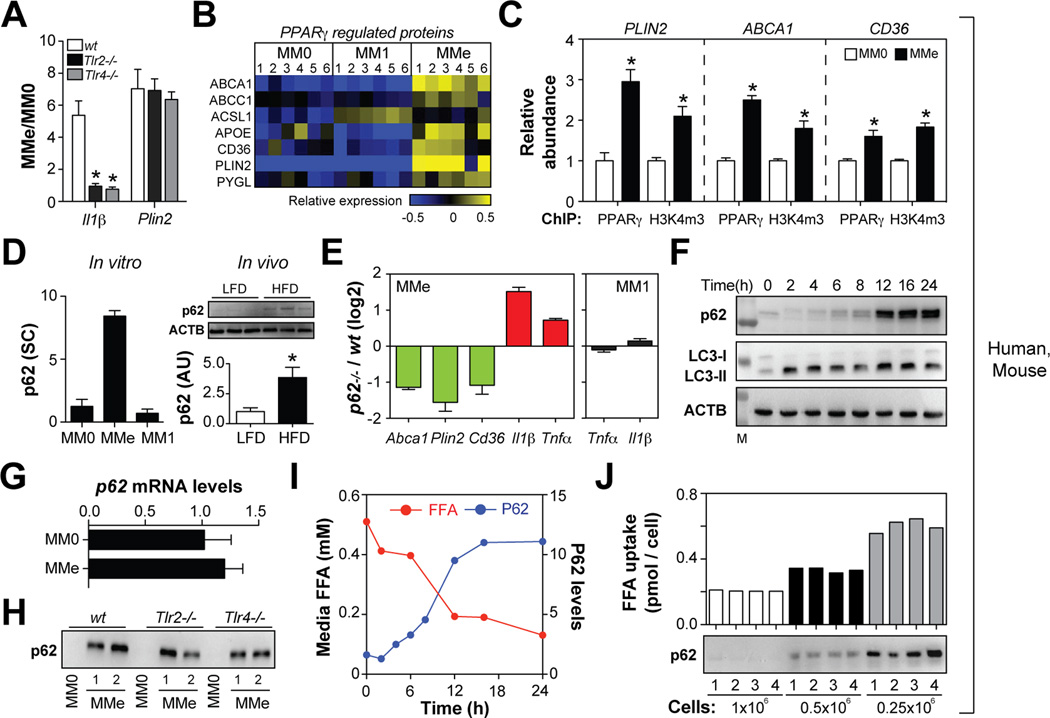
Fig. 6. p62 and PPARγ promote MMe marker expression and limit inflammation.
Panel A: Comparison of gene expression in MMe macrophages made from wild-type (wt), Tlr2−/−, and Tlr4−/− mice. Panel B: Heatmap depicts regulation of PPARγ-regulated proteins across human MM0, MM1, and MMe cells (blue = down-regulated, yellow = upregulated). Panel C: PPARγ binding to its target gene promoters is increased in MMe relative to MM0 macrophages, and correlated with abundance of the open chromatin mark H3K4m3. Relative abundance of MM0 ChIP levels were arbitrarily set to 1. Panel D: Protein levels of p62 in human macrophages in vitro (spectral counts, SC) and in vivo (arbitrary units, AU) in murine ATMs isolated from mice fed a low-fat (LFD) or high-fat diet (HFD). Panel E: Comparison of gene expression in MMe and MM1 macrophages from wild-type and p62−/− mice. Panel F: Kinetics of p62 accumulation and LC3-I/-II levels in human MMe macrophages. Panel G: p62 mRNA levels. Panel H: p62 levels in MM0 and MMe macrophages made from wild-type (wt), Tlr2−/−, and Tlr4−/− mice. Panel I: Kinetics of p62 accumulation and FFA uptake by human MMe macrophages. Panel J: Varying numbers of human macrophages were metabolically activated and palmitate uptake and p62 levels were determined. Where applicable, results are means and SEMs; *, denotes p<0.05, t-test relative to MM0 or LFD; N=3–6. See also Figs. S6, S7.

