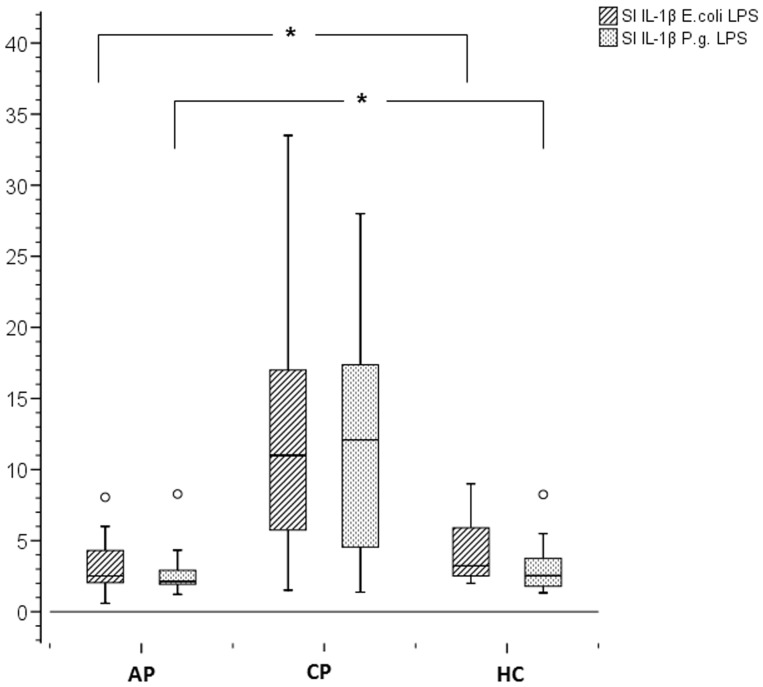
Figure 1. Stimulation Index for IL-1β.
PBMCs (3500 cells/well) were stimulated for 20 hours with different forms of LPS (200 ng/ml). Stimulations were run in duplicate. Boxplots represent minimum, first quartile, median, third quartile, and maximum. Differences between the groups were considered to be significant for p<0.008 (Bonferroni adjustment).

