Figure 1.

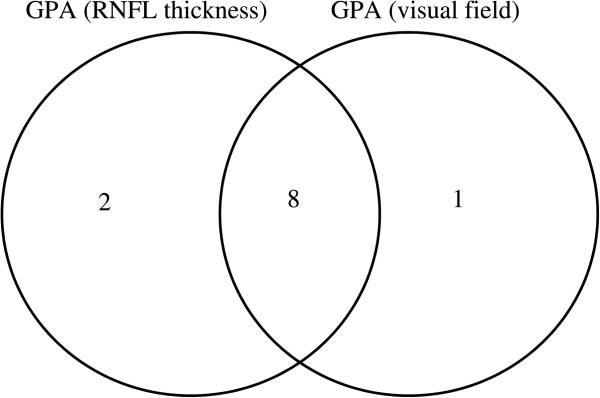
A Venn diagram comparing the number of eyes with progression as determined by OCT GPA and by HFA GPA. The numbers within the diagram indicate the number of subjects found with progression of the disease.

A Venn diagram comparing the number of eyes with progression as determined by OCT GPA and by HFA GPA. The numbers within the diagram indicate the number of subjects found with progression of the disease.