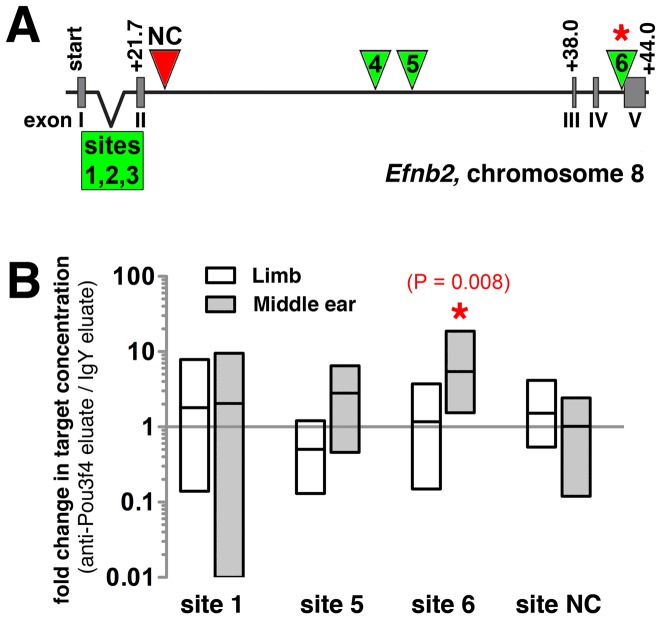
Figure 9. Enrichment of a putative Pou3f4 DNA binding site in anti-Pou3f4 middle ear ChIP eluate compared to IgY middle ear ChIP eluate.
(A) Organization of the murine Efnb2 genomic locus. Green triangles and box identify putative Pou3f4 DNA binding sites (ATTATTA motifs) at non-coding regions. Red triangle identifies the site of a selected negative control target lacking the ATTATTA motif. (B) Change in Pou3f4 DNA binding site abundance resulting from application of either anti-Pou3f4 and IgY IP, as assessed by qPCR and expressed in terms of fold changes for paired data (anti-Pou3f4 eluate/IgY eluate). Data for chromatin preparations from either E12.25 middle ear or E10.5 limb mesenchyme are shown. Each bar represents the range of fold change values obtained for sets of paired data (n = 8 Pou3f4 vs. IgY pulldown pairs, resulting from two qPCR trials with each of four independent chromatin preparations per tissue type; see Materials and Methods). Each horizontal line represents an average fold change.

