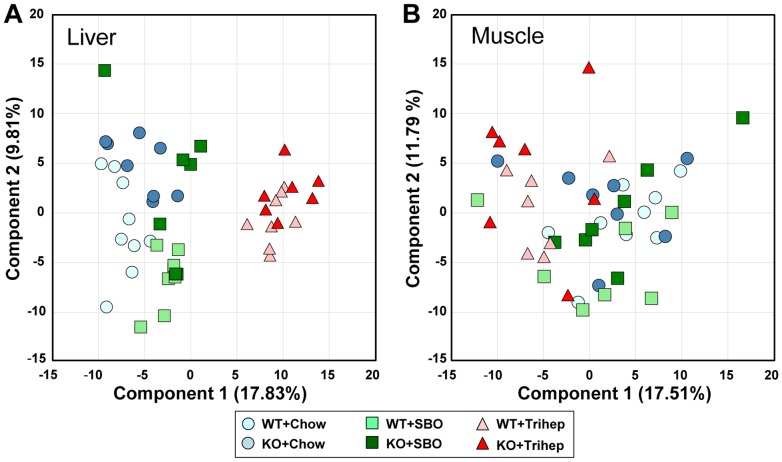
Figure 8. Principal component analysis shows unique metabolomic profile of mice eating triheptanoin diet.
(A) Principal component analysis (PCA) score plot of liver samples from Mecp2 KO and WT mice on triheptanoin diet and control diets. (B) PCA score plot of skeletal muscle samples from Mecp2 KO and WT mice on triheptanoin diet and control diets.

