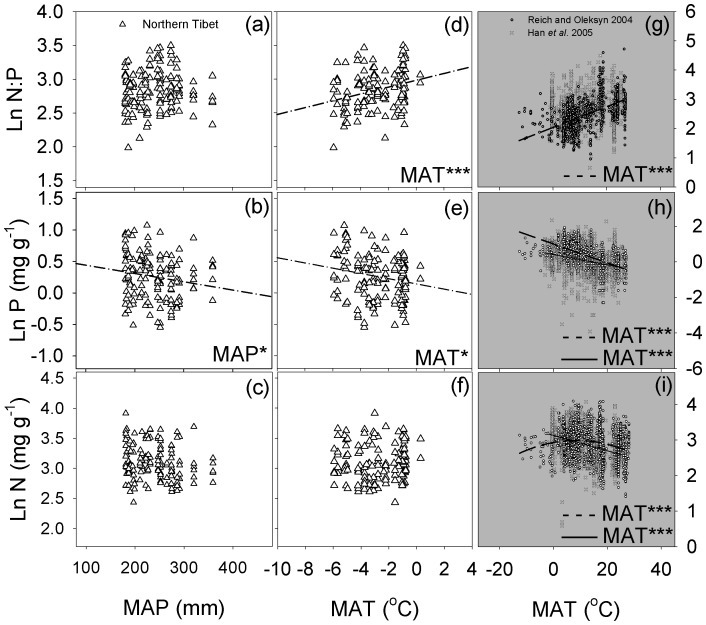
Figure 5. The relationship between the leaf N∶P stoichiometry and the MAP and MAT of the northern Tibetan Plateau (a–f), China and global (g–i).
The dashed dot line represents the fitted straight line of the leaf N∶P stoichiometry with the MAT and MAP on the northern Tibetan Plateau, the dashed line represents the fitted straight (curved) line of the global leaf N∶P stoichiometry with MAT from Reich and Oleksyn (2004), the solid line represents the fitted straight line for Chinese leaf stoichiometry N∶P with the MAT from Han et al. (2005). Regression lines are shown only for relationships that were significant at P<0.05. * and *** represent relationships that significant at the 0.05 and 0.001, respectively.

