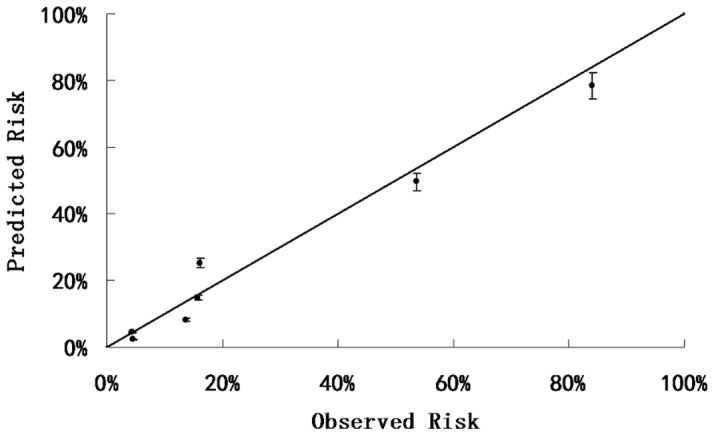
Figure 3. The plot of observed versus predicted risk of SAP in the HNSR cohort.

There was a high correlation between observed and expected probability of SAP (Pearson correlation coefficient, 0.987).

There was a high correlation between observed and expected probability of SAP (Pearson correlation coefficient, 0.987).