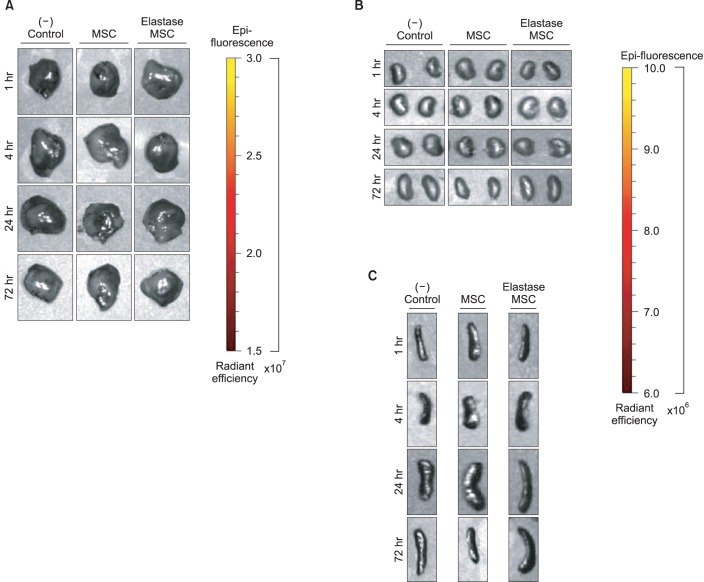
Figure 5.
Ex vivo fluorescence imaging 1, 4, 24, and 72 hours after intravenously quantum dots (QDs)-labeled mesenchymal stem cell (MSC) injection with elastase-induced emphysema. The ex vivo fluorescence images of the liver, kidney or spleen (A-C) from control mice or intravenously QDs-labeled MSC-injected mice with or without elastase-induced emphysema. Representative images are shown (n=7).

