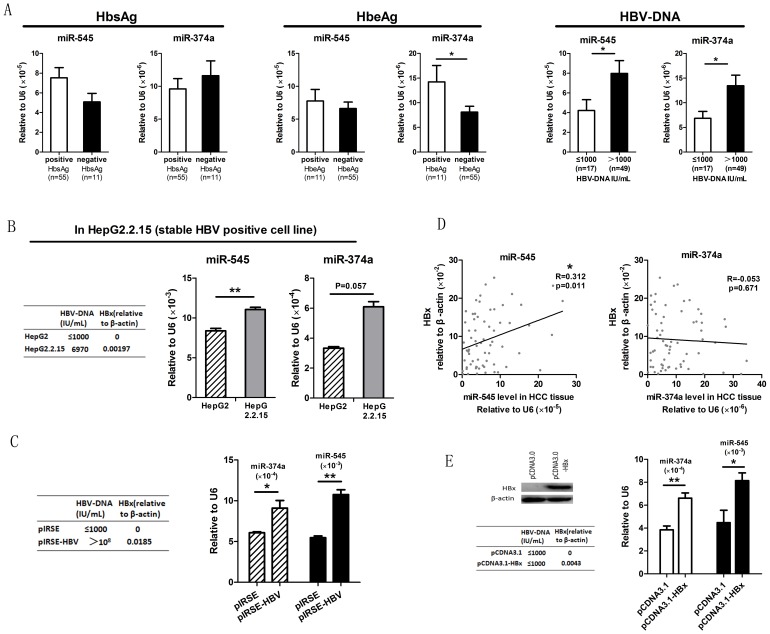
Figure 3. The influence of HBV infection on miR-545/374a cluster expression.
(A) HCC subjects were grouped based on clinical HBV indices including HbsAg, HbeAg and HBV-DNA (Mean±Std.deviation, 10.64±9.158; Median, 7.035). The levels of miR-545 and miR-374a were determined by quantitative RT-PCR. Individual microRNA differences were measured by a student-t test between positive and negative groups. The error bars in A represent mean ± Std. deviation. (B) Comparison of microRNA expression levels between the stable HBV positive cell line HepG2.2.15 and its parental HCC cell line HepG2. The levels of miR-545/374a were monitored by quantitative RT-PCR in both cell lines. The error bars in B represent mean ± Std. deviation. (C) Analysis of microRNA expression levels in cells transfected with a HBV encoding plasmid. Cells were transfected with the HBV genome encoding plasmid (pIRSE-HBV) or the empty plasmid (pIRSE). To confirm the effective transfection of the HBV-genome containing plasmid we performed high-sensitive fluorescent quantitative PCR to detect HBV-DNA and quantitative real time PCR to detect HBx protein expression. The expression of miR-374a and miR-545 was measured by quantitative RT-PCR. *P<0.05, **P<0.01, independent t test. The error bars in C represent mean ± Std. deviation. (D) Analysis of miR-545/374a and HBx expression levels in HBV HCC subjects. The levels of miR-545/374a and HBx mRNA were assayed by quantitative RT-PCR. *P<0.05, Pearson's correlation. (E) Analysis of miR-545/374a expression in HBx overexpressing cells. Bel-7402 cells were transfected with a plasmid expressing HBx (pCDNA3.1HBx) or with an empty plasmid (pCDNA3.1). Western blotting and quantitative RT-PCR were used to confirm HBx protein expression after transfection. The levels of miR-545/374a were assayed by quantitative RT-PCR. The error bars in E represent mean ± Std. deviation. *P<0.05, **P<0.01, independent t test.

