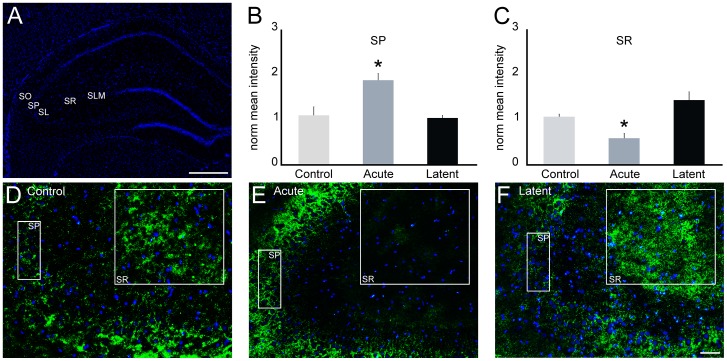
Figure 7. Cx43 distribution in CA3 after epileptiform activity.
Immunofluorescence experiments were performed to analyze the distribution of Cx43 (green) in coronal sections of rats from control, acute and latent groups counterstained with DAPI (blue). (A) Coronal section labeled with DAPI showing CA3 strata oriens (SO), pyramidale (SP), lucidum (SL), radiatum (SR) and lacunosum-moleculare (SLM). (B, C) Quantification of mean pixel intensity (n = 4 animals per group) showed significant increase in SP and decrease in SR in the acute period (E) compared to controls (D). In these subfields, we were not able to detect changes in the latent period (F), as well as in the other strata in both acute and latent periods (data not shown). Bars represent standard errors of mean. *P<0.05 vs. Control group in Tukey's HSD pairwise comparisons after one-way ANOVA. Scale bar: 50 µm.

