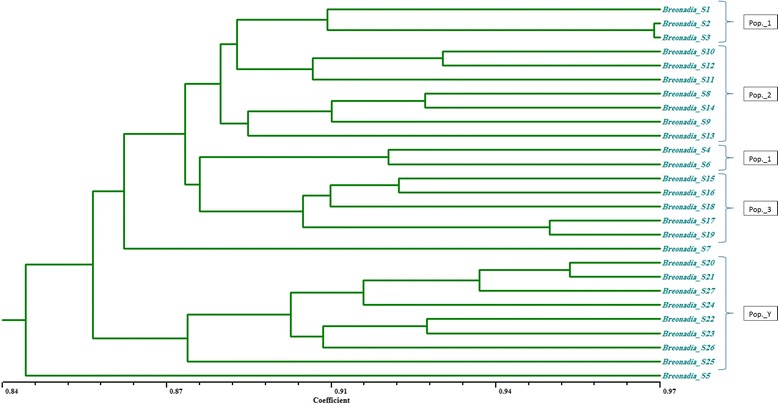
Figure 4.

Dendrogram obtained from UPGMA cluster analysis of 27 accessions of Breonadia salicina . The scale bar corresponds to genetic distance based on Jaccard’s similarity coefficient.

Dendrogram obtained from UPGMA cluster analysis of 27 accessions of Breonadia salicina . The scale bar corresponds to genetic distance based on Jaccard’s similarity coefficient.