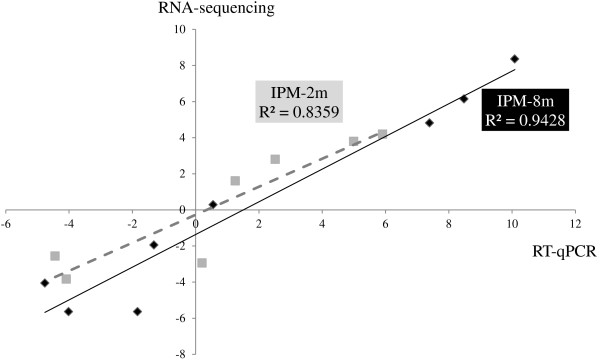
Figure 1.

Validation of the transcriptome results. The transcriptomic results obtained through RNA sequencing were validated using qualitative RT-PCR (RT-qPCR) analysis. The level of differential expression of eight genes was compared, showing a correlation between RNA sequencing (Y-axis) and RT-qPCR analysis (X-axis). The level of differential expression between A. baumannii ATCC 17978 and their mutants is given as Log2-values. R2, the coefficient of determination.
