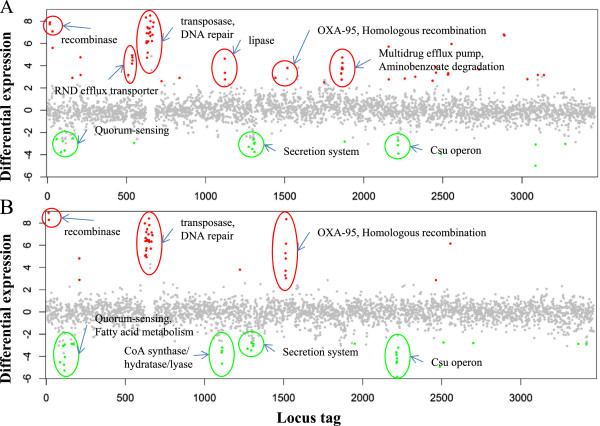
Figure 3.

Overview of the transcriptional difference between the IPM strains and the ATCC 17978 wild-type strain. Comparative transcriptomics are displayed as differential expression (log2 transformed fold change) in (A) IPM-2 m and (B) IPM-8 m relative to ATCC 17978. The dots indicate the differential expression of all open reading frames, sorted on the x-axis according to the locus tag. Genes with p-values < 0.05 are considered differentially expressed. The red dots indicate up-regulated genes, whereas the green dots indicate down-regulated genes. Some differentially expressed genes are indicated in the literature and KEGG pathway information.
