
Figure 1. Metabolic parameters in wt (black symbols) and Alms1GT/GT (white symbols) male mice.
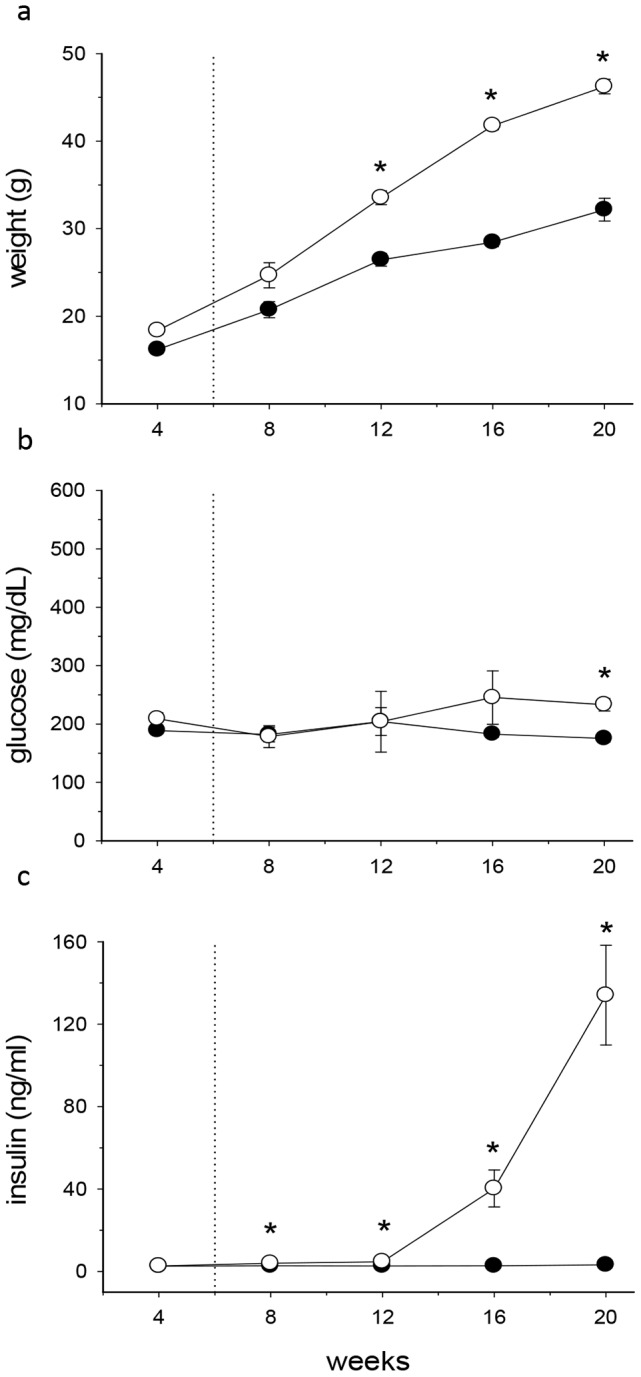
The body weight (a), plasma glucose (b) and insulin levels (c) were evaluated at 4 week intervals. Dotted lines denote the age (6 weeks) of mice characterized in the present study. Data are expressed as mean values ±SEM, n = 15. *p<0.01 wt vs. Alms1GT/GT.