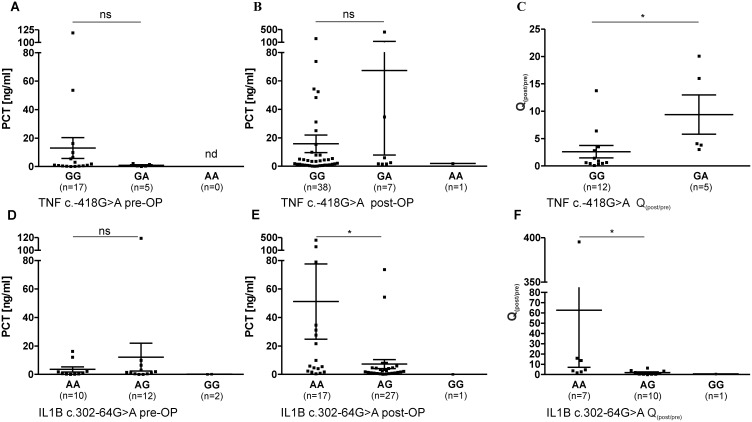
Figure 3. Pre- and postoperative PCT levels (mean ± SEM), as well as factorial change Q(post/pre) of PCT in the course of surgical intervention in patient sera (ns: not significant; nd: not determined, * = P<0.05).
3A–C: PCT levels in correlation with TNF c.-418G>A; A: Preoperative PCT level, B: Postoperative PCT level, C: Q(post/pre) of PCT in the course of surgical intervention; 3E–G: PCT levels in correlation with IL1B c.302-64G>A; A: Preoperative PCT level, B: Postoperative PCT level, C: Q(post/pre) of PCT in the course of surgical operative intervention.

