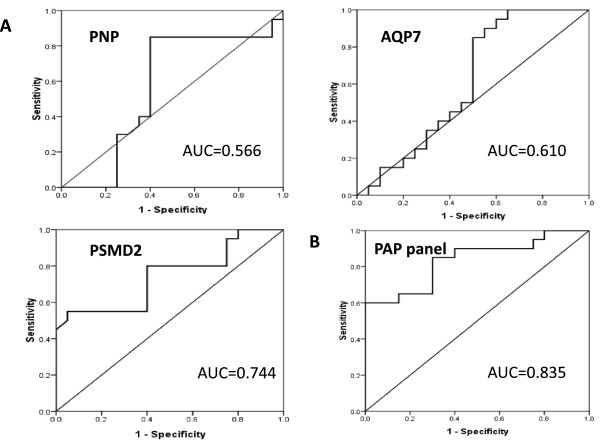
Figure 5.

ROC curves for DHAS and LDSDS differentiation in HBC. ROC curves were generated using mRNA expression data with DHAS (n = 20) and LDSDS (n = 20) in HBC. A, AUC of PNP, AQP7 and PSMD2 were 0.566, 0.610 and 0.744, respectively. B, AUC of mRNA panel of combination of PNP, AQP7 and PSMD2 (PAP panel) was 0.835.
