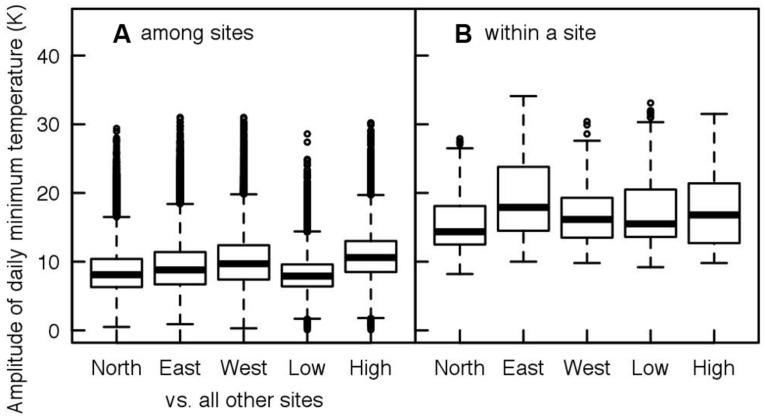
FIGURE 2.
Daily variation of minimum air temperature at five extreme locations within the distribution of Fagus sylvatica (see Figure 1 for the location of the sites) for a same date among the five locations (A, spatial scale), and within a site for the same day of the year across years from 1900 to 2010 (B, temporal scale). Note that the extent of temperature variation within a site for a given day exceed the maximum variation of temperature that occurs at a given date between the two extreme locations of the distribution area of the species.

