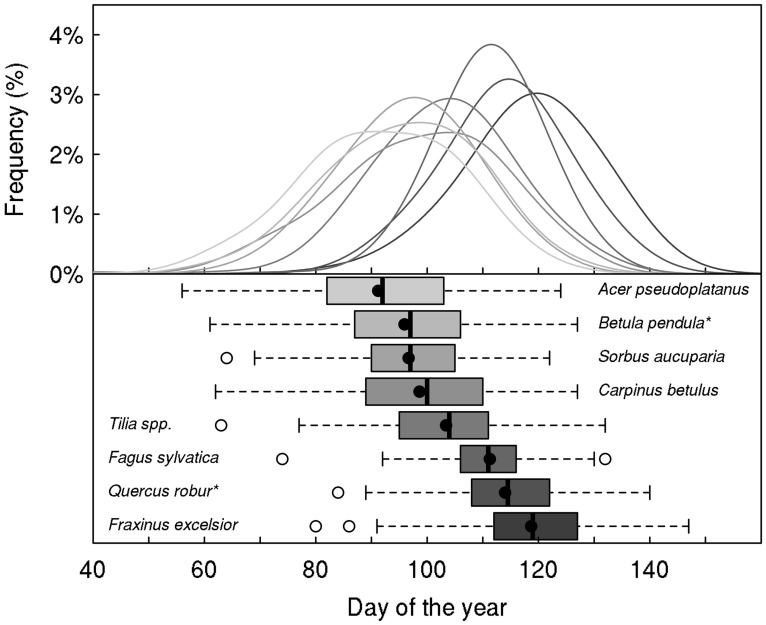
FIGURE 3.
Marsham phenological records (Sparks and Carey, 1995). The upper panel shows the frequency of distribution of the leaf-out dates in Norfolk (UK) for eight temperate tree species over the period 1736–1958 (between 158 and 178 years available, depending on species). The distribution was fitted by a Gaussian–Kernel density distribution with a bandwidth of 7 days for each species. The box-plots show median, quartiles, and extremes of the phenological data, with the mean given as filled circle. Species names followed by an asterisk indicate that this is the probable species but we are uncertain.

