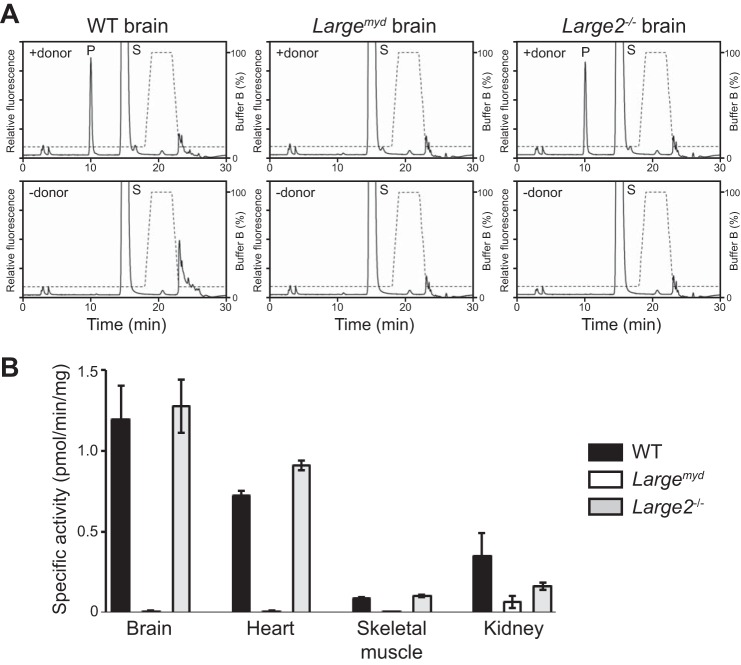
FIGURE 6.
The GlcA-T activity in mouse tissues from WT, Largemyd, and Large2−/− mice. A, representative HPLC (LC-18 column) of the product obtained from the LARGE GlcA-T reaction using solubilized microsomes extracted from the brain of each mouse. P, product. S, unreacted substrate. Dotted line, %B buffer. B, specific GlcA-T activity on solubilized microsomes extracted from tissues of the WT, Largemyd, or Large2−/− mice. Data obtained from three individual animals are shown, with error bars indicating the standard deviations.

