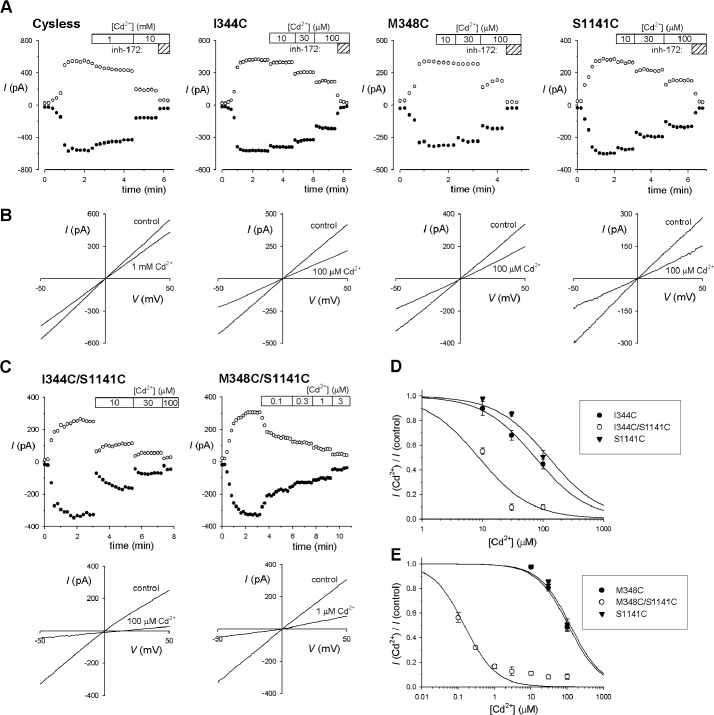
FIGURE 2.
Effects of Cd2+ on single and double cysteine mutant channels in TMs 6 and 12. A, sample time courses of current activation (by PKA application in the presence of ATP, at time 0) and inhibition by Cd2+ (at the concentrations indicated at the top of each panel) for the named CFTR variants. Currents were monitored using depolarizing voltage ramps (B) and are plotted at −50 mV (●) and +50 mV (○). The identity of CFTR currents was confirmed by sensitivity to CFTRinh-172 (5 μm; indicated by hatched bars marked inh-172). B, sample macroscopic I-V curves for these same four membrane patches, recorded before the addition of Cd2+ (control) and after the addition of the noted concentration of Cd2+. C, sample time courses (upper panels) and I-V curves (lower panels) recorded from similar experiments for the double cysteine mutants I344C/S1141C (left) and M348C/S1141C (right). D and E, concentration-dependent inhibition of the single (filled symbols) and double (open symbols) cysteine mutants channels indicated, indicating the increase in Cd2+ apparent affinity when individual cysteine mutants in TMs 6 and 12 are combined. Data have been fitted as described under “Experimental Procedures.” Mean of data from 3–9 patches. Error bars indicate the means ± S.E.

