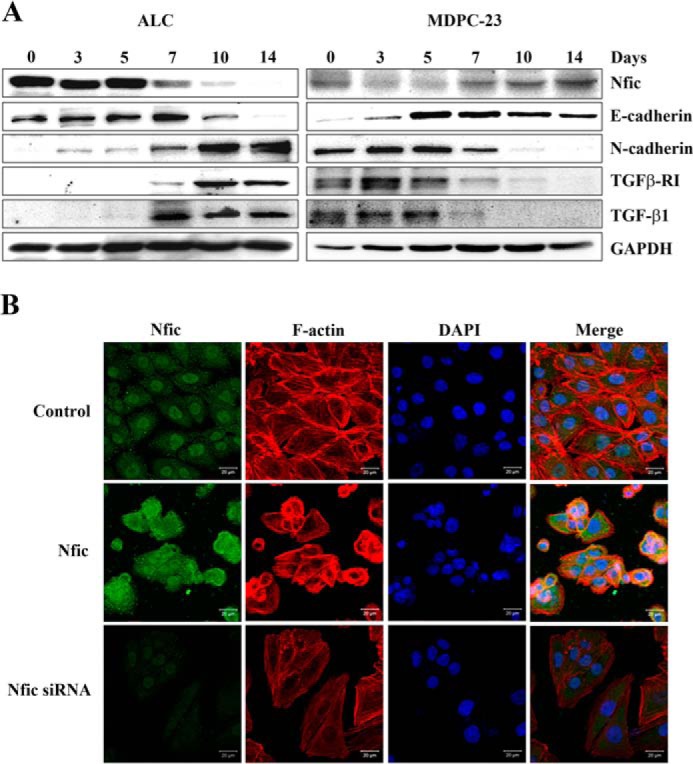
FIGURE 6.

Expression pattern of Nfic, cadherins, and TGF-β signaling factors during ameloblast and odontoblast differentiation in vitro. A, protein levels of Nfic, E-cadherin, N-cadherin, TGFβ-RI, and TGF-β were determined by Western blotting in ALC (left panel) or odontoblastic MDPC-23 cell (right panel) cultures after 14 days in differentiation medium. GAPDH was used as a loading control. B, Nfic expression (green) and phalloidin staining (F-actin, red) with nuclei counterstained (blue) was detected by fluorescence microscopy in MDPC-23 cells transfected with Nfic-expressing or Nfic siRNA constructs. Scale bars, 50 μm.
