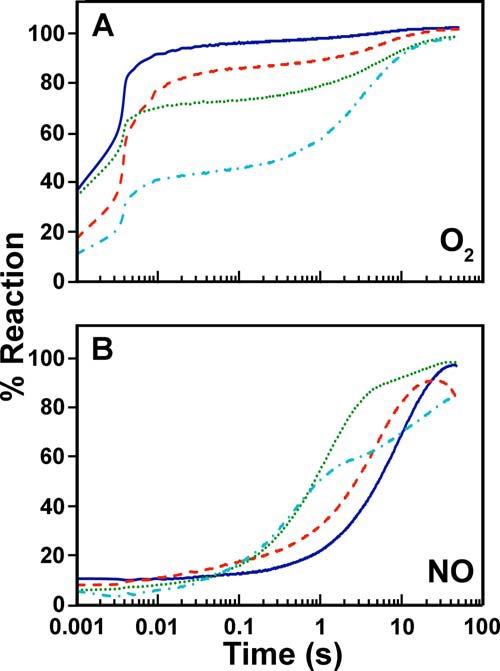
FIGURE 6.

Reaction of reduced WT and mutated EhFdp1 with O2 and NO. Kinetic profile measured for each mutant in the reaction with O2 (panel A) or NO (panel B). Solid blue line, WT; dashed red line, K53D; dotted green line, Y271S; dash-dotted cyan line, K35D/Y271S. Experimental conditions as in the legend to Fig. 5.
