
FIGURE 3.
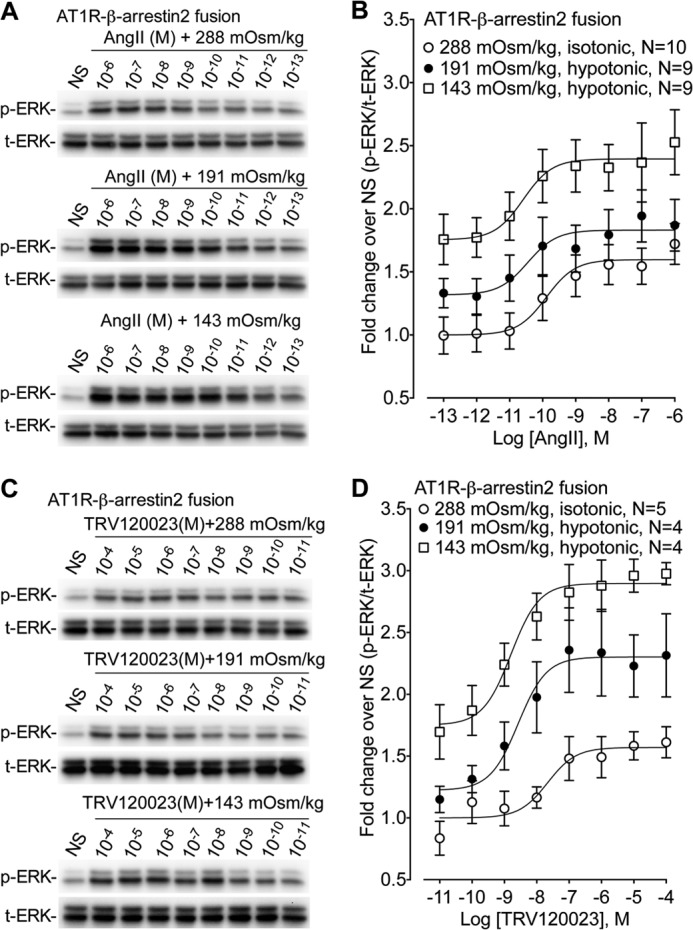
Osmotic stretch allosterically modulates AT1R signaling. The effect of the balanced agonist AngII and the β-arrestin-biased agonist (n = 9–10) on ERK phosphorylation was tested in cells stably expressing AT1R-β-arrestin2 fusion proteins under isotonic (288 mOsm/kg) and hypotonic osmotic stretch (191 and 143 mOsm/kg). A, representative immunoblots showing enhanced ERK phosphorylation in response to increasing hypotonic osmotic stretch over a range of AngII concentrations. NS, nonstimulation. B, dose-dependent increase in ERK phosphorylation with the balanced agonist AngII stimulation. Increasing hypotonicity augmented Emax but had no effect on EC50 (n = 9–10). Isotonic 288 mOsm/kg (Emax = 1.63 ± 0.15, LogEC50 = −9.84 ± 0.37 nm); hypotonic 191 mOsm/kg (Emax = 1.96 ± 0.20, LogEC50 = −9.36 ± 0.56 nm); hypotonic 143 mOsm/kg (Emax = 2.57 ± 0.27, LogEC50 = −9.78 ± 0.50 nm). Emax, p < 0.02, hypotonic 143 mOsm/kg versus isotonic 288 mOsm/kg (one-way ANOVA with Bonferroni correction). C, representative immunoblots showing enhanced ERK phosphorylation in response to increasing hypotonic osmotic stretch over a range of TRV120023 concentrations. NS, nonstimulation. D, dose-dependent increase in ERK phosphorylation with the β-arrestin-biased agonist TRV120023. Increasing hypotonicity significantly enhanced both Emax and EC50 (n = 4–5). Isotonic 288 mOsm/kg (Emax = 1.62 ± 0.07, LogEC50 = −7.24 ± 0.49 nm); hypotonic 191 mOsm/kg (Emax = 2.67 ± 0.36, LogEC50 = −8.37 ± 0.27 nm); hypotonic 143 mOsm/kg (Emax = 3.33 ± 0.19 ±, LogEC50 = −8.87 ± 0.18 nm). Emax, p < 0.001, hypotonic 143 mOsm/kg versus isotonic 288 mOsm/kg; p < 0.05 hypotonic 191 mOsm/kg versus isotonic 288 mOsm/kg. LogEC50, p < 0.05 hypotonic 143 mOsm/kg versus isotonic 288 mOsm/kg (one-way ANOVA with Bonferroni correction). The data represent the means ± S.E. NS, nonstimulation.