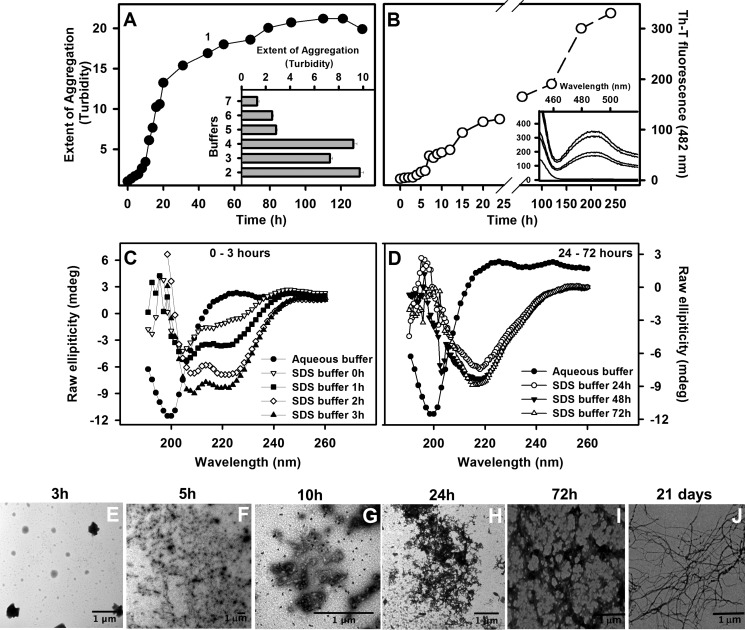
FIGURE 2.
Characterization of the WT peptide aggregation. A, the WT peptide was incubated at 100 μm at room temperature with different buffers and aggregation monitored by turbidity at 330 nm (inset). Turbidity was normalized by the initial values obtained for each sample. The constitution of each buffer is as follows: 10 mm HCl, 5 mm SDS (buffer 1); 10% acetonitrile (buffer 2); 50% TFE (buffer 3); 50% DMSO (buffer 4); 10 mm HCl, 20% TFE (buffer 5), 200 mm sodium acetate, pH 5.0 (buffer 6); and 5 mm Triton X-100 (buffer 7). B shows the Th-T binding assay performed with the sample incubated on HCl-SDS buffer at different times. Th-T fluorescence was obtained by exciting the samples at 440 nm and collecting the emission from 400 to 600 nm. The intensity at 482 nm was used to probe amyloid formation. The inset shows examples of Th-T fluorescence emission spectra. C and D, secondary structural changes during the aggregation kinetics in HCl-SDS as monitored by CD, showing the transient population of α-helical conformers at initial aggregation times (C) and the conversion toward a β-sheet-rich conformation at 24 h (D). TEM was performed with samples aggregated in SDS for 3 h (E), 5 h (F), 10 h (G), 24 h (H), 72 h (I), and 21 days (J). All bars in the images represent 1 μm. Error bars, S.E.

