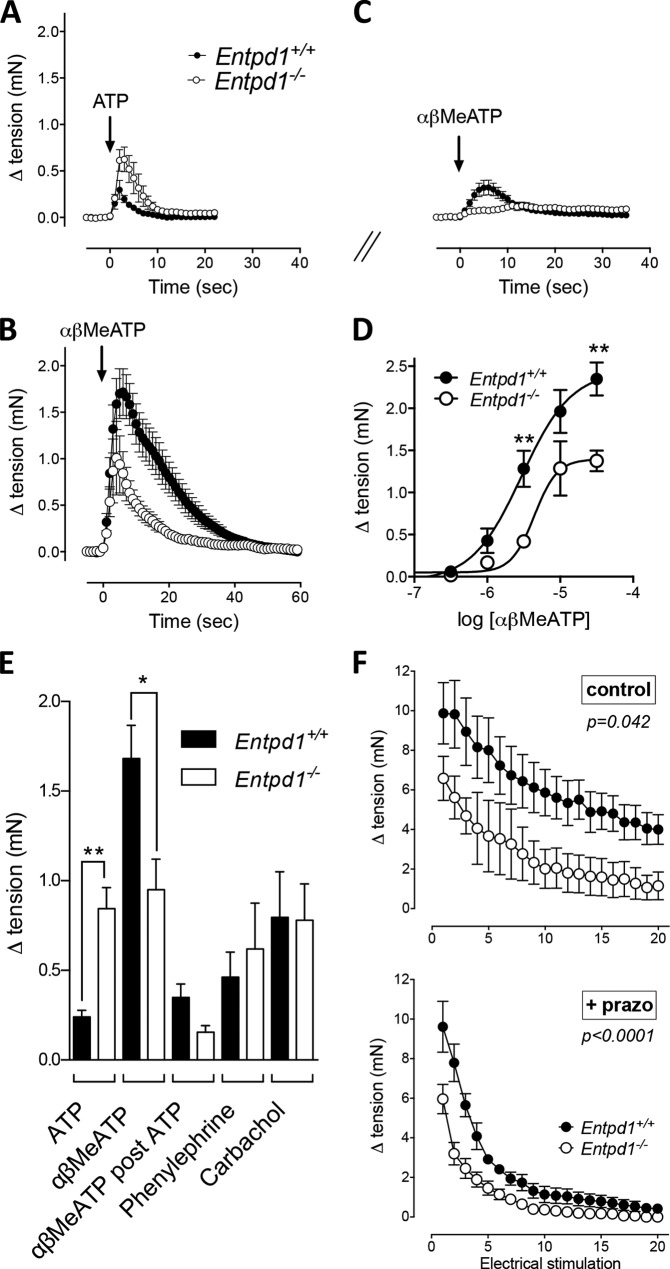
FIGURE 3.
NTPDase1 regulates P2X1 activation in the vas deferens. Shown is the time course of contraction induced by exogenous ATP (100 μm) (A), αβMeATP (10 μm) alone (B), or αβMeATP (10 μm) (C) after incubation with 100 μm ATP for 20 min (desensitization). D, concentration-response curve of αβMeATP-induced contraction. **, p < 0.01. E, constrictor responses elicited by phenylephrine and carbachol (10 μm each) were similar in both genotypes. Error bars represent mean ± S.E. of 4–12 independent experiments performed on tissues from four to seven mice and were compared using one-way analysis of variance. *, p < 0.05; **, p < 0.01. F, comparative isometric tension of Entpd1+/+ and Entpd1−/− vas deferens in response to repeated electrical field stimulation (10-s duration, 20 Hz, 45 V, 0.5-ms pulse) every minute. Data represent mean ± S.E. of seven or eight independent preparations. Two-way analysis of variance followed by Fisher's least significant difference test was performed.

