FIGURE 3.
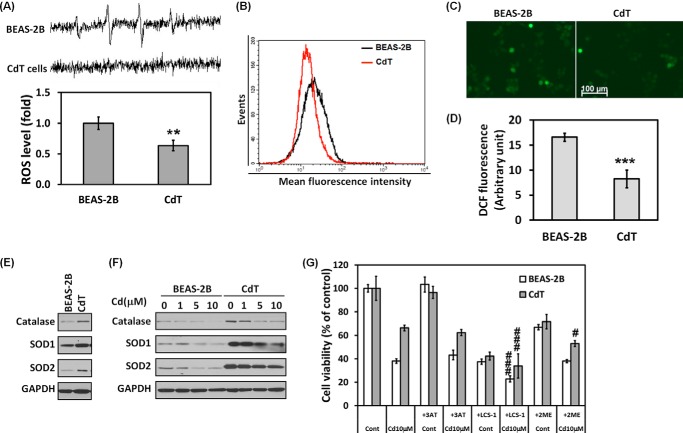
Cadmium-transformed BEAS-2B cells have a low level of ROS due to high expression of antioxidant enzymes. To measure a basal level of ROS, the cell suspensions were prepared from cadmium-transformed BEAS-2B cells or normal cells; afterward, an ESR spectra was recorded. The generation of a 1:2:2:1 quartet ESR signal was shown (A, top), and the signal intensity of DMPO-OH was represented (A, bottom). ROS levels of the cadmium-transformed BEAS-2B cells and their parent BEAS-2B cells also were measured by using flow cytometry (B), fluorescence microscopy (C), and fluorescence microplate reader (D) after staining with CM-H2DCFDA (5 μm) for 30 min. In addition, the basal cellular levels of catalase, SOD1, and SOD2 were measured (E). The effects of cadmium (0–10 μm) on the antioxidant enzymes of the transformed cells or normal cells also were analyzed by Western blot (F). For the inhibition assay, both cells were incubated with cadmium (10 μm) for 24 h in the presence or absence of 3AT (10 mm), LCS-1 (10 μm), and 2ME (1 μm), and then cell viability was performed by an MTT assay (G). The ESR spectrometer settings were as follows: frequency, 9.8 GHz; power, 39.91 milliwatts; modulation frequency, 100 kHz; receiver gain, 5.02 × 10⁵; time constant, 40.96 ms; modulation amplitude, 1.00 G; scan time, 60 s; magnetic field, 3,451 ± 100 G. All spectra shown are an accumulation of five scans. The results are shown as the mean ± S.E. (error bars) of three separate experiments. **, p < 0.01; ***, p < 0.001 versus the normal BEAS-2B cells. #, p < 0.05; ###, p < 0.001 versus the cadmium-treated control cells (ANOVA, Scheffe's test). GAPDH was used as a loading control. CdT, cadmium-induced transformed BEAS-2B cells; 3AT, catalase inhibitor; LCS-1, SOD1 inhibitor; 2ME, SOD2 inhibitor.

