
Figure 6.
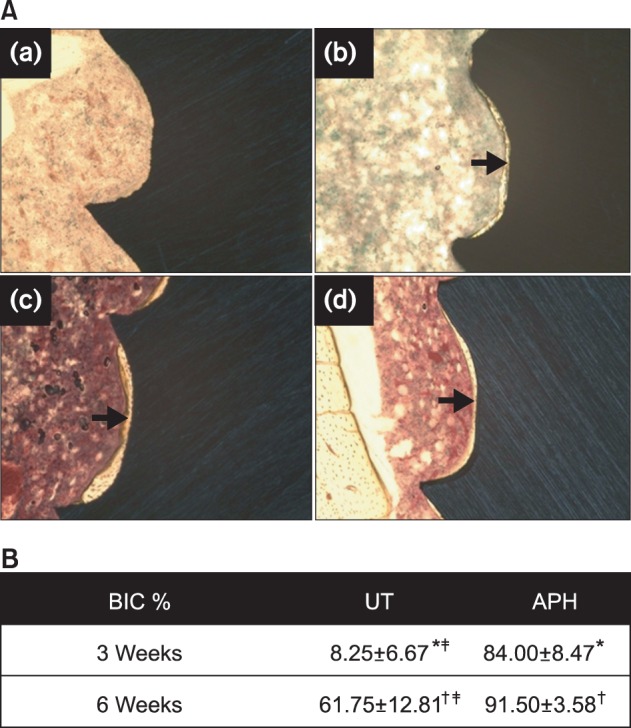
A, Histologic images (Villanueva staining, ×100) of the bone-miniscrew interface for (a, c) UT and (b, d) APH samples (a, b) in 3 weeks and (c, d) 6 weeks after insertion. B, Percentage of bone-implant contact (BIC%) measured on 5 threads of UT and APH-treated miniscrew interfaces. Values are presented as mean ± standard deviation.
*,†,‡Each marks indicate significant differences between groups (p < 0.05).
UT, Untreatment; APH, anodization, cyclic precalcification and heat treatment.