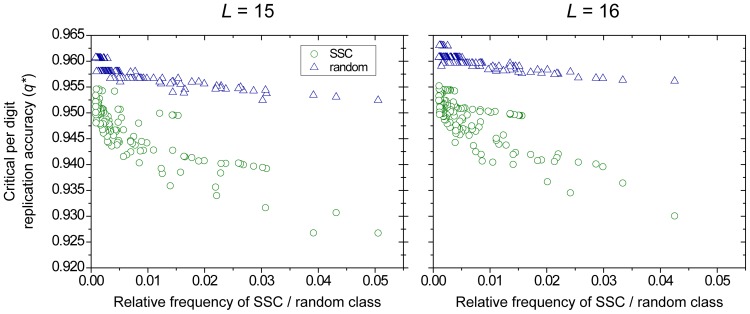
Figure 2. Error threshold for random sequences.
The green circles represent SSCs based on secondary structures (as in Fig. 1), blue triangles represent the error threshold of classes of random sequences of the same size as the corresponding SSC. Results are for  (left) and
  (right).

