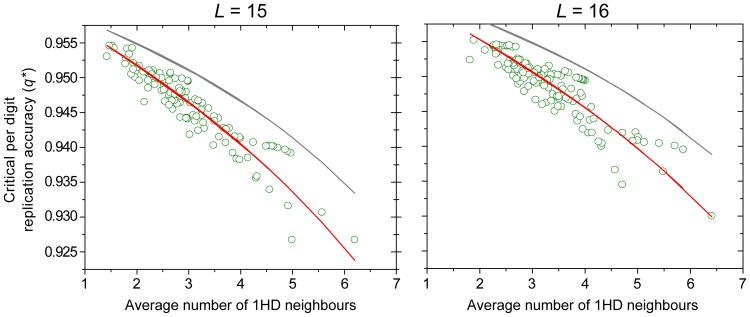
Figure 3. Correlation of the error threshold with average number of 1–Hamming distance neighbours.
Critical per digit replication accuracy of SSCs as a function of the average number of 1–Hamming distance neighbours for sequences in the SSC. Red curves show fit of Eq. 3 to the data points, while the dark gray curve show fit to Eq. 3 with no back-mutations ( ). Results are for
  (left) and
  (right). The average number of 1HD neighbours can be transformed to
  by dividing it by the length of the sequence.

