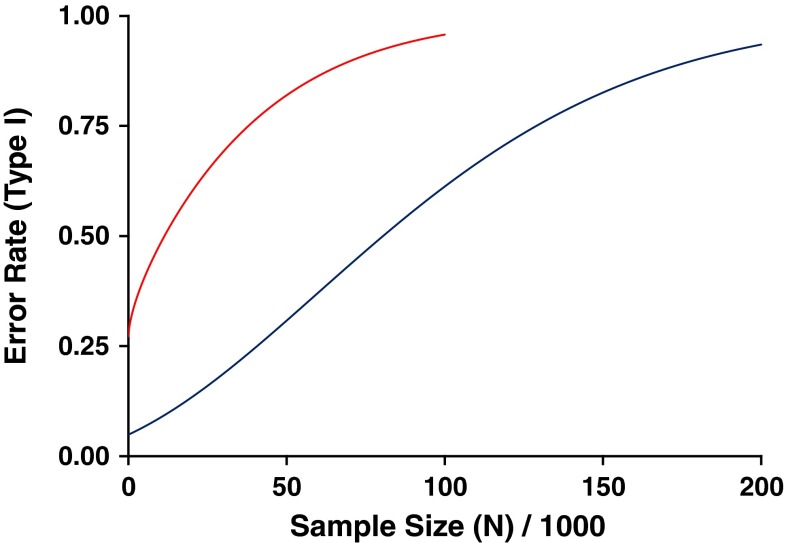
Fig. 3.
Conservative estimate for the type I (false positive) error rate expected in MOB studies of differing size (N = the number of cases = the number of controls, in thousands), reproduced with permission from our original publication [9]. The lower curve indicates the probability of identifying any month showing a significant difference; p value < 0.0042 (= 0.05 Bonferroni corrected for the number of months), while the upper curve indicates the probability of seeing a nominally significant excess in at least one spring month and/or a nominally significant deficit in at least one winter month

