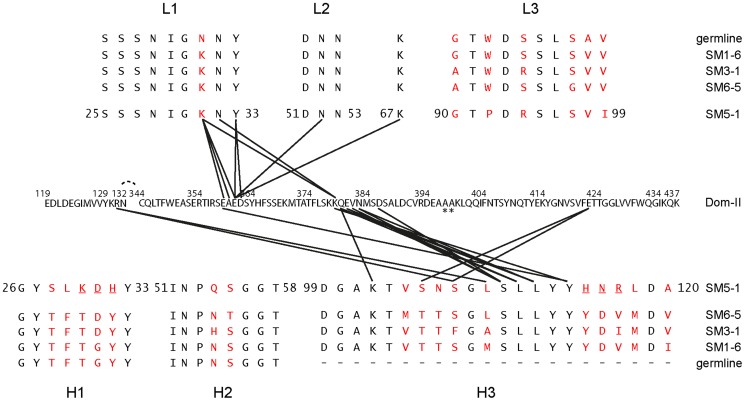
Figure 3. Contacts between Dom-II and SM5-1 together with an alignment of the CDRs of related antibodies.
Black lines indicate intermolecular distances smaller than 3.5 Å. The Dom-II sequence is reported in its entirety, while for SM5-1 only the amino acid sequences of the CDRs and of frame work residue Lys67 are displayed. Asterisks indicate mutations in engineered Dom-II in the complex. The CDR sequences of the highly related antibodies are provided and listed either above or below the SM5-1 sequence. Amino acids that differ in any of the sequences are highlighted in red. SM5-1 residues that were substituted in silico for the molecular dynamics simulations are underlined.

