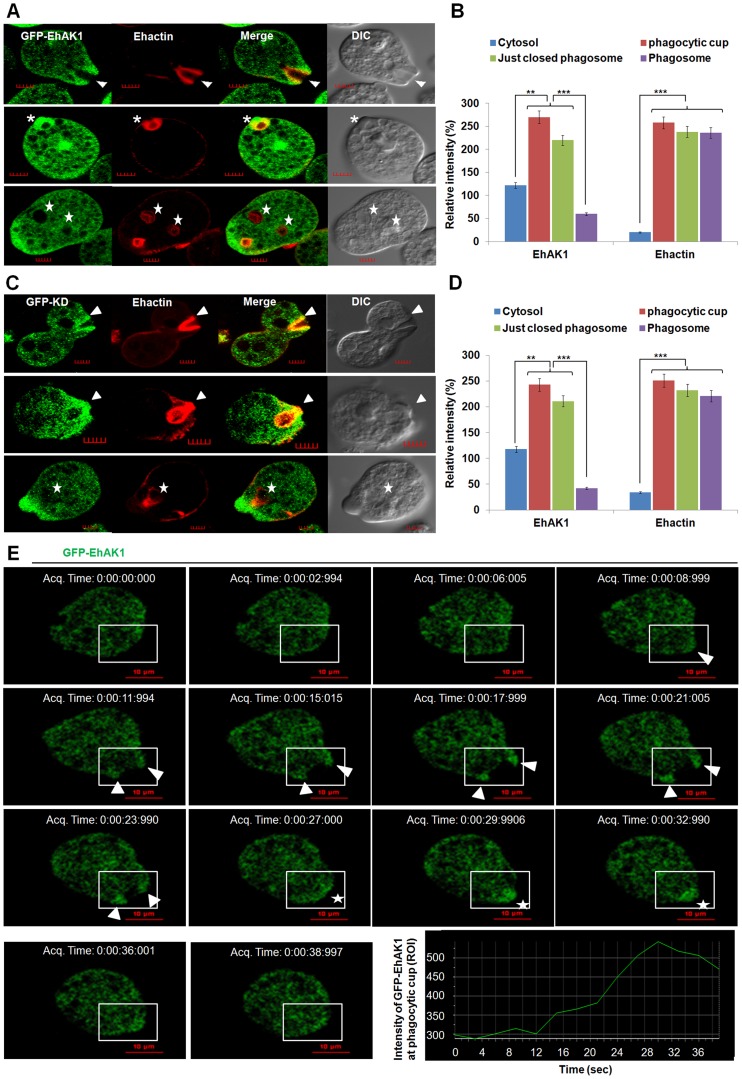
Figure 3. In vivo localization of GFP-EhAK1 in phagocytosing cells.
(A) and (C) Imaging of GFP-EhAK1 and GFP-KD and colocalization with actin during erythrophagocytosis. GFP-EhAK1 and GFP-KD expressing cells were grown for 48h with 30µg/ml G418 and incubated with RBC for different time at 37°C. Immunostaining was performed using anti-GFP antibody followed by Alexa-488. F-actin was stained with TRITC-phalloidin. EhCaBP1 was immunostained with specific antibodies and visualized using Pacific blue-410 (blue). Arrowheads indicate phagocytic cups, asterisks mark just closed cups and star marks phagosome. Bar represents 5 µm. (B) and (D) Quantitative analysis of fluorescent signals was done as in Fig. 1D. (E) Time lapse imaging of GFP-EhAK1. The montage shows a time series of GFP-EhAK1 expressing cells undergoing erythrophagocytosis where phagocytic cups are marked by arrowhead and just closed phagosomes by star. Bar represents 10 µm. Graph shows the intensity of GFP-EhAK1 (ROI) at a phagocytic cup every 3s. *p-value≤0.05, **p-value≤0.005, ***p-value≤0.0005.

