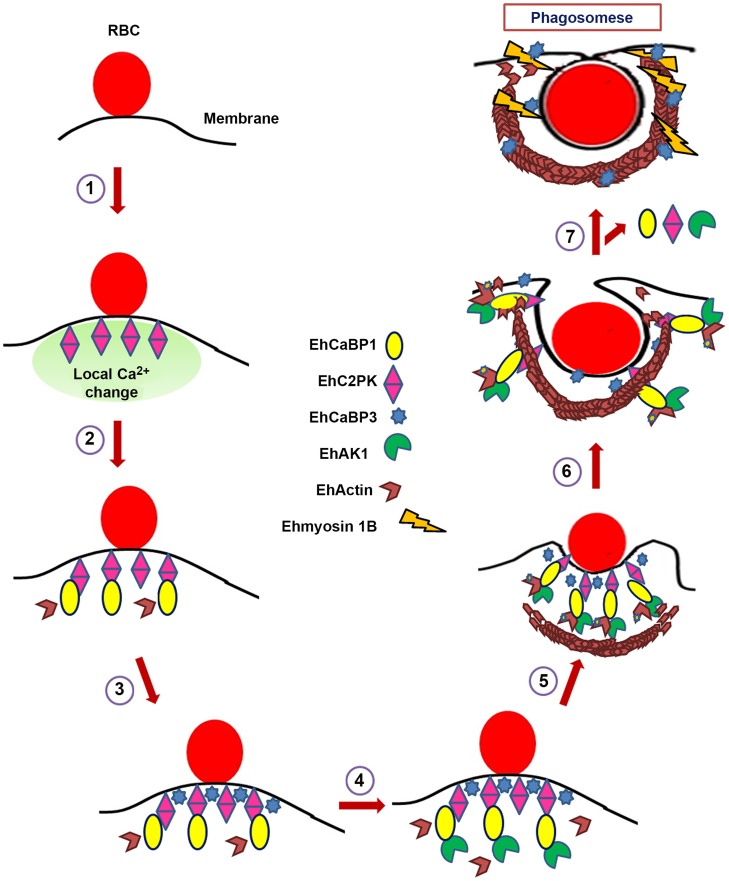
Figure 10. Model depicting RBCs phagocytosis in E. histolytica.
Model summarises predicted course of events for initiation of phagocytosis in E. histolytica as derived from our experiments. There are other molecules involved in the process, but these are not shown here, for brevity. 1. Attachment of RBC to the membrane increases concentration of EhC2PK at the attachment site (Ca2+ dependent). 2. Recruitment of EhCaBP1 at the site through interaction with EhC2PK (Ca2+ independent). Recruitment of some actin molecules. 3. Recruitment of EhCaBP3 at the site (independent of EhCaBP1). Recruitment of some actin molecules. 4. Recruitment of EhAK1 at the site through binding with EhCaBP1 (Ca2+ dependent). 5. Recruitment of other actin modulating molecules. Activation of actin dynamics pathway including phosphorylation by EhAK1 leading to enhanced actin dynamics. 6. Actin polymerization and progression of cups towards phagosome. 7. Recruitment of Ehmyosin 1B through EhCaBP3 and EhCaBP1, EhC2PK, EhAK1 leave.

