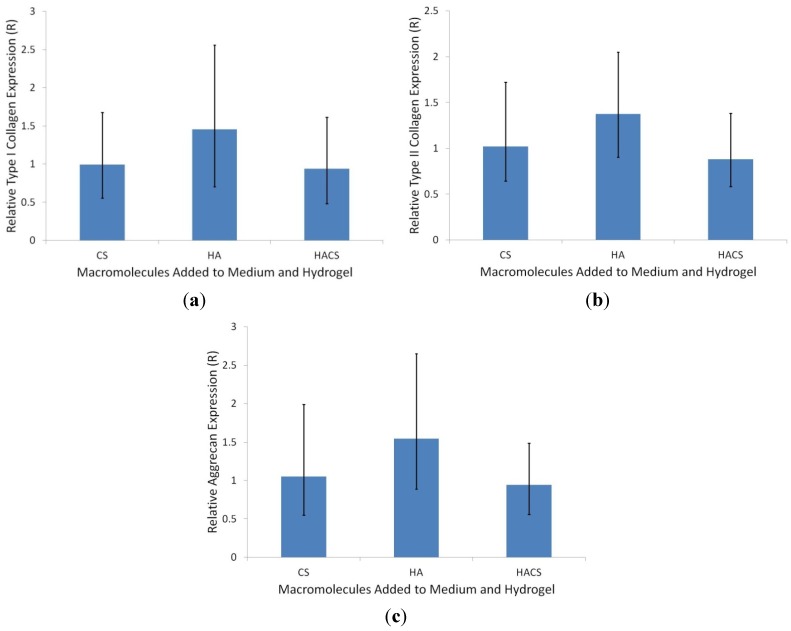
Figure 3.
Graphs depicting the relative expression levels (R) of the mRNAs that code for (a) collagen type I, (b) collagen type II and (c) aggrecan in hydrogels supplemented with CS (n = 7), HA (n = 6) and HACS (n = 7), expressed as the ratio of their corresponding mRNA levels in non-supplemented hydrogels, which are assigned an R value of one. The bar heights represent the median ± standard error as calculated by the Relative Expression Software Tool (REST) statistical analysis. (Note: the collagen I, collagen II and aggrecan gene expression values shown are normalized against the mRNA level for the constitutively expressed GAPDH transcript. There was no significant difference in GAPDH RNA levels between the HA, CS, HACS and non-supplemented hydrogel treatment groups; data not shown).

