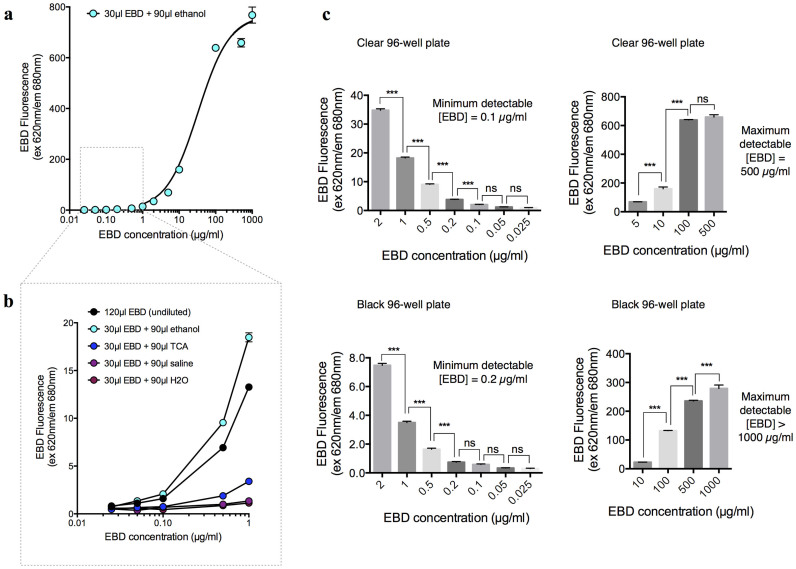
Figure 1. Evans blue dye (EBD) fluorescence (620 nm excitation/680 nm emission) detection.
Standard curve showing EBD fluorescence as a function of dye concentration in clear (a–c) and black (c) 96-well plates. (a) Full EBD standard curve based on a 1:3 ethanol dilution. Each 30 µl replicate of EBD (in 50% TCA/0.9% saline) was supplemented with 90 µl of 95% ethanol to ensure consistent optic path length. Concentrations of the 30 µl replicates are indicated on the x-axis. (b) EBD standard curves for the 120 µl undiluted dye (in 50% TCA/0.9% saline) and 30 µl dye (in 50% TCA/0.9% saline) diluted to 120 µl with one solvent: 95% ethanol, 50% TCA, 0.9% saline, or water. Concentrations of the 120 µl undiluted dye and the 30 µl dye (prior to dilution) are indicated on the x-axis. (c) The maximum and minimum detectable EBD concentrations in the clear and black 96-well plates were determined by Tukey's multiple comparisons tests. A significant difference (***P<0.001) indicates a detectable concentration difference, and no significance (ns; P>0.05) indicates that the concentration difference was not detectable.

