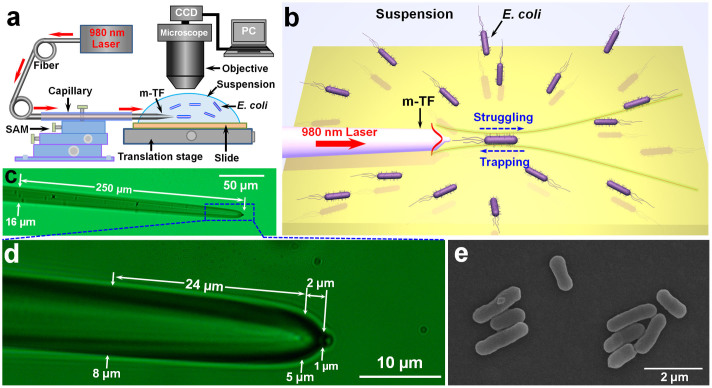
Figure 2. Experimental schematic and characterization of the modified tapered fiber and E. coli.
(a) Schematic illustration of the experimental setup, the red arrows indicate the propagation of the laser beam. (b) Schematic illustration of the non-contact optical trapping and single bacterium dynamics. (c) Optical microscope image of the modified tapered fiber. (d) Details of the tapered region of the modified tapered fiber as shown in the dashed blue region of (c). (e) SEM image of the E. coli bacteria.

